Translate

Sunday, August 31, 2014

Race and the Vote in the Pacific Northwest (Whatcom County) : Part II

"We face, therefore, a moral crisis as a country and a people. It cannot be met by repressive police action. It cannot be left to increased demonstrations in the streets. It cannot be quieted by token moves or talk. It is a time to act in the Congress, in your State and local legislative body and, above all, in all of our daily lives. It is not enough to pin the blame on others, to say this a problem of one section of the country or another, or deplore the facts that we face. A great change is at hand, and our task, our obligation, is to make that revolution, that change, peaceful and constructive for all. Those who do nothing are inviting shame, as well as violence. Those who act boldly are recognizing right, as well as reality." - President John Fitzgerald Kennedy on Civil Rights June 11, 1963.
This piece continues my work on CVAP data and demographics in Whatcom County (See 1, 2).  Most of the code (and some ouput) for this piece is here.  My guess is that the key piece of OFA's victory in 2012 derived from the engagement of people of color not only in Whatcom County but throughout the nation. The 42nd district races in 2014 present opportunities particularly for the Democratic Party to engage many county based Hispanics and Native Americans and a surprising number of people of color who live in block groups or precincts that are part of the 42nd.  The data here is 2010 Block Group Data. For statewide only updated estimates see the Census data explorer.

The Democrats I grew up with in the Bay Area (e.g. Phil Burton, Willie Brown, Ronald Dellums, Barbara Lee, George Miller, Gus Newport among many other local politicians) made it a point to engage in political dialog with all of their constituencies in a state whose legacy included Cesar Chavez, the Black Panthers, and historical civil rights activism. I simply don't see this type of engagement from local political leaders in Washington state outside of perhaps Seattle. Yet the emerging electoral profile of WA state is increasingly made up of people of color. This is one view (race and ethnic groups are overlaid with transparent (alpha channel) color) of the  multi-racial spectrum of Whatcom County's non white citizens by Census Block Group. Click to Enlarge :

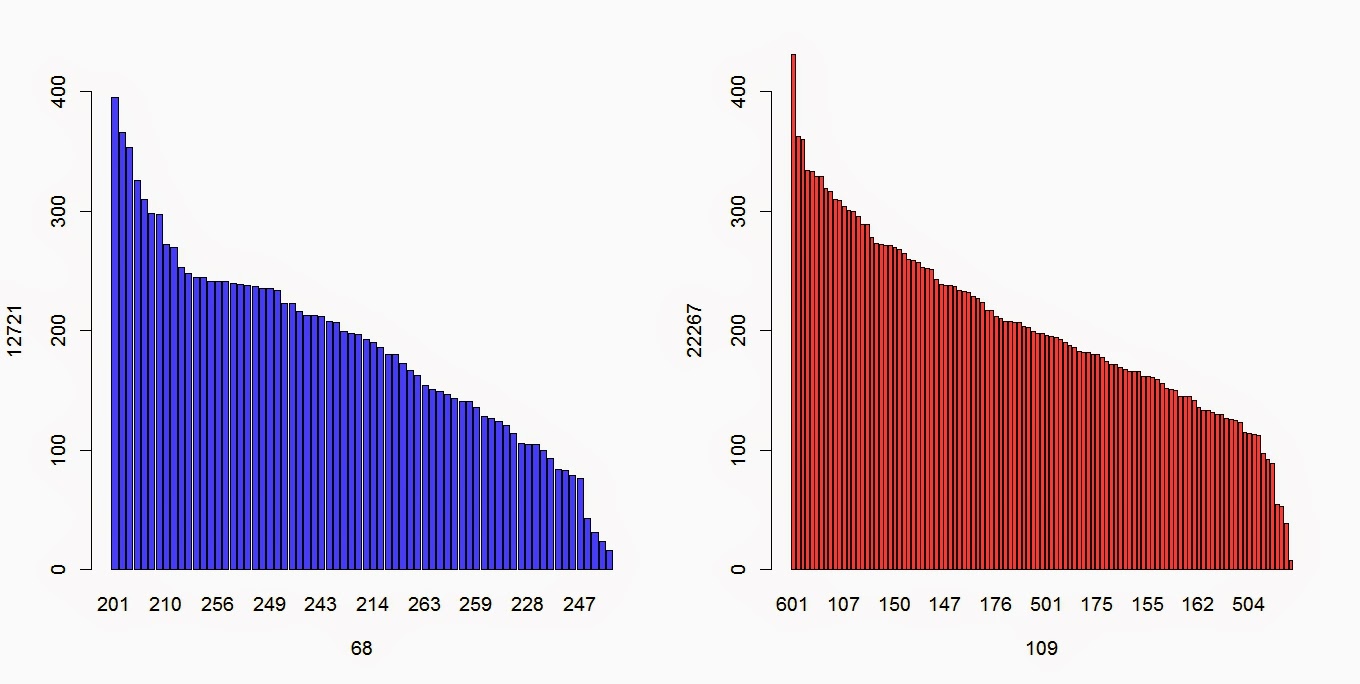
Note on this graphic: These population estimates in this charts are limited to 750 max for perspective. For grouped and not overlaid charts see Barcharts of All Races and Ethnicity (far below).

Friday, August 22, 2014

Race and the Vote in the Pacific Northwest : Part I

Post Ferguson, pre-election: Let us discuss Race and the Vote in the Pacific Northwest.


Technical for this post is here . -RMF
One bright Farmer's market Saturday morning two weeks ago, when downtown Bellingham seemed almost unbelievably hip, sunny, and organic all in the same breath, I stopped to chat with a group supporting farm worker rights in WA. They talked about their struggles to form a union, receive adequate housing on local farms.  I asked how many farms are unionized in Washington State?  Only one other at this time, was the answer. However, Latino and Hispanic peoples have a long history in WA. We are full  of talk about community in Bellingham, WA.  Most of the time the community concerns are those of a white community.

Racial divides are often not what people think of first when contemplating Washington State. Our endless rain and Microsoft's endless success assure that when most of the nation thinks about us, it isn't in terms of racial conflict. Historically, if wasn't too long after Lewis and Clark had returned from their expedition to the Northwest that the nation was busy crafting the Missouri Compromise. During the civil war era, Washington was a remote outpost, not achieving statehood until 1889. For all municipal purposes, Washington remained for a long time a bastion for escapees, Utopians  and frontiersman. For the devotees of a "White Homeland", eastern Washington still holds this type of promise.  It comes as a shock to a native of Oakland, Ca to see such separatist web sites.. But then advertisements on the local bus system in Oakland while I was growing up promoted the possibility of a separate homeland for African-Americans created from the Southern states. I don't expect the concept of either black or white separatism will ever find much acceptance.

It is unlikely that the future of Washington state will retain anything segregationist,remote or frontier like about it. Positioned as the gateway to the Pacific Rim, bordering some of the fastest growing and heterogeneous cities in both the U.S. (Portland, Oregon)  and British Columbia (Vancouver, Canada), Washington state is home to one of America's most impressive and growing urban centers (Seattle). Washington state is poised to become not only a serious immigration destination, but an international economic engine. What will be the racial composition of this state in the future? Below, I use CVAP data ('Citizen Voting Age Population') from the 2008 - 2012 American Community Survey to look at the state of Washington as a whole and Whatcom County specifically. Here are the 2012 estimates of citizens and the voting age population by race/ethnicity:

TITLE Sum(CIT_EST) Sum(CVAP_EST)
Total 6,258,320 4,737,840
Not Hispanic or Latino 5,713,835 4,466,845
White Alone 4,788,925 3,840,125
Hispanic or Latino 544,500 270,980
Asian Alone 352,720 263,595
Black or African American Alone 209,164 152,309
American Indian or Alaska Native Alone 81,860 59,515
American Indian or Alaska Native and White 66,875 47,280
Asian and White 78,738 35,736
Remainder of Two or More Race Responses 46,695 24,124
Native Hawaiian or Other Pacific Islander Alone 34,113 23,322
Black or African American and White 49,048 16,871
American Indian or Alaska Native and Black or African American 5,696 3,942


Tuesday, August 19, 2014

42nd District By The Numbers


42 WA LD Boys vs. Girls by Precinct
The data below is from Active Voter database from 08/01/2014 for the 85829 voters in the 119 precincts of the WA 42 LD only. Click on the Graphs to enlarge. Code and output are here.

Wednesday, August 13, 2014

GIS Sources of Electoral Information: Part I

Updated with Block Group list and Annotated Block Group shapes location.
Should be noted that GIS representations of precincts are not up to date any longer -RMF

Below are three GIS representations of Bellingham Precincts, Whatcom County Precincts (2011), and CVAP information and Block Groups (2012). This GIS data has been developed for three different agencies (City, County, Census),  each of which have emphasized three different sets of information. Consequently, hybridizing precincts data with Block Group data is a difficult task. This is a shame since co-ordinated GIS could tell us in which precincts registered and non-registered voters live.

The City of Bellingham holds the most dense collection of precincts in Whatcom County. In total, the 68 200 series precincts hold almost 40% (49,632) of total registered voters. There may well be many more voters in these districts that have not registered. It would be nice to know where they are.:

Tuesday, August 12, 2014

42nd LD Primary Turnout and Active Voter Information

This post is just raw data and charts. Not a conversational or analytic post. 

This is essentially 42 LD WA data from a recent Active Voter Database and August Primary returns from accumulated "match backs". It shows turnout percentages with that data. This will be useful to PCOs and campaign managers who are worried about why their full precincts turned out so little or why some precincts have lower Active Voter rolls than others. There are two groups:

  • 200 Series (Urban Bellingham proper)
  • Rest of Precincts (Everyone else in Whatcom County)
12 Charts are far below. Click to Enlarge. The lattice charts should enable you to pick out your precinct and contemplate electoral participation. So will the lists.  There will be second quarter 'ERIC' reductions in the active voter list. There will some number of the "Undeliverables" that will be placed on inactive status. There will be increasing registration by both parties for all precincts. In the next three months, change will come to the active voter list.

Sunday, August 10, 2014

Fwd: The Central Valley: where oil and water mix

Editor's Note: I find Kate Gordon's "Cliff Notes" some of the most readable, engaging and detailed analysis of energy and climate news anywhere. I recommend you subscribe.

---------- Forwarded message ----------
From: Kate Gordon <feedback@thenextgeneration.org>
Date: Fri, Aug 8, 2014 at 2:52 PM
Subject: The Central Valley: where oil and water mix
To: rferrisx@gmail.com

Fwd: Fracking the last best place

Editor's Note: The fracking threat to Whatcom County is real possibility. No one covers the disaster that is fracked gas and oil like Josh Fox and Gasland.

---------- Forwarded message ----------
From: Gasland The Movie <admin@gaslandthemovie.com>
Date: Fri, Aug 8, 2014 at 12:03 PM
Subject: Fracking the last best place
To: rferrisx@gmail.com


Gasland, A Film By Josh Fox

Saturday, August 9, 2014

Our place in the Alliance...

With about ~5K votes left to count in WA, Whatcom County has returned the 8th highest number of ballots for last Tuesday's primary. The registered voter turnout averaged 30% for the state as a whole and the turnout numbers were miserable for the top 10 ballot returning counties.  Below, I use CVAP (Citizen Voting Age Population) ratios to examine those top 10 counties performance in last Tuesday's primary. Below TB_CVAP represents Total.Ballots/CVAP_EST and RV_CVAP represents Registered.Voters/CVAP_EST.

      County Total.Ballots   TB_CVAP Registered.Voters CVAP_EST   RV_CVAP
1       King        340948 0.2536098           1175330  1344380 0.8742543
2     Pierce        120667 0.2120145            442910   569145 0.7782024
3  Snohomish        106292 0.2145493            417448   495420 0.8426143
4    Spokane         98773 0.2822892            281056   349900 0.8032466
5      Clark         71463 0.2413638            251835   296080 0.8505640
6     Kitsap         50703 0.2681918            154069   189055 0.8149427
7   Thurston         46893 0.2506240            163027   187105 0.8713129
8    Whatcom         42540 0.2850633            126961   149230 0.8507740
9     Yakima         33702 0.2411937            106925   139730 0.7652258
10    Benton         32661 0.2746122             98612   118935 0.8291252

These top ten WA counties contain:
  • 944,642 out of 1,204,391 total ballots for this primary election to date
  • 3,218,173 out of 3,925,658 total registered voters statewide
  • 3,838,980 out of 4,737,840 of the CVAP of WA (2012 most recent estimate).
Whatcom County usually plays above it's electoral and demographic weight. Although less populous than Yakima, we regularly contribute thousands more in ballots.  Our turnouts are often strong enough to chase a significantly more populous Thurston County.  One day, we may well catch them.The last two general elections have cemented our reputation as a county that gets out the vote and brings home seats for the Democrats for both federal (2012) and county (2013).  And the question on everyone's mind this year is: Can we do the same in November for the monstrous and all important WA 42 LD?  (to be continued....)

Friday, August 8, 2014

STUDENTS and OTHERS: Special PUBLIC SERVICE ANNOUNCEMENT: How To Make Sure You Receive your Ballot when you come back!!

Note: Updated the numbers for the last matchback on August 8, 2014 -RMF

Challenged (left) and Undeliverable (right)  by precinct for the Whatcom County August primary election. Note the nearly 10x difference in the Y axis scale. Click to Enlarge.
The first part of this post is a public service announcement for voters. Below the break is my usual technical piece for party types, politicos, data analysts and other numbers/political power obsessed.

If you have not registered to vote for the general election, do so now at www.myvote.wa.gov.  I talked extensively with the Whatcom County election desk and others about 1,927 'undeliverable' (returned) ballots, some of which came from the 200 series precincts centered around WWU. Here is some information on reactivation of your voting status if you leave Bellingham for the summer.

If you are registered active voter (e.g. student) and you move home for the summer, your registration status becomes inactive if your mail-in ballot is 'undeliverable' for the (August) Primary election. When you return in the fall, simply log in to MyVote WA (www.myvote.wa.gov) with your name and birthdate, *UPDATE* your registration with your new Whatcom County/Bellingham address, and *presto* you will become an active voter here again. It is probable that many of you changed your voter registration address when you moved home (e.g. out of Whatcom County) so you could vote in your home county WA primary. Most probably, you would have not been mailed a Whatcom County ballot here. If you were a registered voter in Whatcom County, and if 'home' for you was not a county in WA State, you most probably were mailed a Primary ballot to your school year address. Simply change your voter registration to a Whatcom County address when you return to your new residence in Whatcom County in the fall. You will be activated.

Student or not, if you move, you *MUST* change your address every time you change residence. You can do this  either on-line (*preferable method*) at www.myvote.wa.gov or by calling the elections desk for Whatcom County. Do this as soon as you find your new place here in Whatcom County.  There is no automation or reminder for you to change your voting address. This does not happen 'automagically' when you forward your mail via the USPS.  Unless you set up it, your smart phone or tablet or email will not remind you to change your voter registration address. It's all up to you.

Thursday, August 7, 2014

Whatcom County Match Back Report : 08.06.2014

~42K good ballots have been returned as of 08.06.2014. The "Undeliverables" did not increase for this round of match backs. 416 ballots have status "Challenged".  This give us to date:

AVReturnStatus  freq
1     Challenged   416
2           Good 42059
3  Undeliverable  1841

        AVReturnChallenge  freq
1                         42059
2               No Ballot     2
3            No Signature    90
4      No Signature Match   263
5  Second Ballot Received     1
6           Undeliverable  1841
7 Wrong Voter's Signature    53
8            Z - Deceased     2
9               Z - Other     5

The 600 series precincts (Lynden proper) are making their usual strong participatory showing in the top 40 returned precincts. Legions of high numbered 200 series precincts (mostly 40th LD) fill out the ranks of the bottom 40 returned precincts; all of which have returned 175 ballots or less.  However, with at least two more match backs  to go (there have been late returns), the top 11 200 Series precincts are returning ~ 400 more ballots than the top 11 600 series precincts. For example, we can do this:

Tuesday, August 5, 2014

Primary Election night : Initial thoughts

"We had to struggle with the old enemies of peace—business and financial monopoly, speculation, reckless banking, class antagonism, sectionalism, war profiteering.
They had begun to consider the Government of the United States as a mere appendage to their own affairs. We know now that Government by organized money is just as dangerous as Government by organized mob. 
Never before in all our history have these forces been so united against one candidate as they stand today. They are unanimous in their hate for me—and I welcome their hatred."  Franklin D. Roosevelt, 1936
I am surprised by the strength of the Democratic vote tonight. I feared much worse at such low turnout levels. It is my general observation that when the electoral contest in Whatcom County garners more than 60,000 votes, the Democrats win.  The Democrats should find such victory in November. Whatcom county  has been proven Democrat by default in the last two general elections. In many ways, the 2014 general election is now the Democrats to lose. The primary results appear very much reflective of party ticket voting, but also of a genuine "purpality" in 42nd LD precincts.

Whatcom County Matchback Report : 08.05.2014


0.8.05.2014 Matchback "Good" Returns: 200 Series Precincts (Left) vs Rest of County (Right). 200 series are Bellingham city only precincts (40% of active voters as of 08/01/2014).

Fwd: Monday/Tuesday call to action

---------- Forwarded message ----------
From: "Joy Monjure" <voteforjoy@gmail.com>
Date: Aug 3, 2014 8:50 PM
Subject: Monday/Tuesday call to action
To: "Ryan Ferris" <rferrisx@gmail.com>
Cc:


Friends of Joy Monjure
Ryan --

We have turned the corner into the final stretch of the primary campaign, and I am teaming up with my running mates Seth and Satpal to boost Democratic voters in the primary election this week.  Right now, the team is making over 5000 calls per day to get out my message and get out the vote this primary.  With strong voter participation, we can turn the spotlight onto the issues that are so important to our community.  Will you help our Democratic team earn a strong primary turnout?

I need your help making phone calls Monday or Tuesday at 1228 Bay Street in Bellingham.

Matchback going into election day...


Primary "good" returns as of August 4 cumulative "match backs". 200  (Bellingham) series in blue. All other Whatcom County precincts in red. X label is number of precincts. Y label is returns.
For the 42nd precincts only:


Friday, August 1, 2014

REMEMBER TO VOTE!!!! This is the Whatcom County Matchback Report 08.01.2014

Here is your hasty Whatcom County Primary matchback report for 08.01.2014:
  • 24,092 ballots are noted as returned  with some status as of  ~ 4:00 PM this evening.
  • 1552 were found undeliverable
  • 190 have been challenged
  • 177 precincts are reporting
To check your ballot status, go to http://myvote.wa.gov