This is my third attempt at testing my air filters with my Aware Electronics RM-80 this year. My first two attempts (1, 2) produced ambiguous results. However, I have refined my test methods. Let me give a fuller explanation of my testing and test environment. I have a now ten year old Carrier 'Infinity 16' zoned heat pump system that provides continual fresh air. This is recommended for allergic asthmatics by some and I find that by and large I and our family is healthier with it. However, my filters trap lots of what appears to be 'carbon black' or essential carbon. I assume most of this is from wood burning in Bellingham which I discuss in detail here. Code for this post can be found here and here.
My hypothesis is that the fallout from naval submarine bases like Bangor-Kitsap and most recently Fukushima has resulted in increased levels of radioisotopes in the air, water, hydrological cycle, and in the smoke derived from the wood burned in many homes in the Pacific Northwest for heat. My testing device (Aware Electronics RM-80) is a sensitive and capable Geiger-Mueller counter. However, I can not directly identify radioisotopes without the purchase of an expensive gamma spectrometer. Another hypothesis I have is that I should be able to see an increase in radioactivity as the months progress and the plume of radiation from Fukushima becomes more and more part of our water cycle.
Because I am testing inside air filtered by mulitple layers of air filters, my base line probably suffers some bias. I could use a more portable Geiger-Mueller counter. Come to think of it, a rad lab, a small team of scientists, and multiple outdoor stationary test facilities might be nice as well. Maybe I will pitch something at KickStarter.com. In any event, my most recent filter testing produced good evidence that the air outside my house may have higher levels of radioactivity than the air inside would have otherwise. Let me examine these results below:
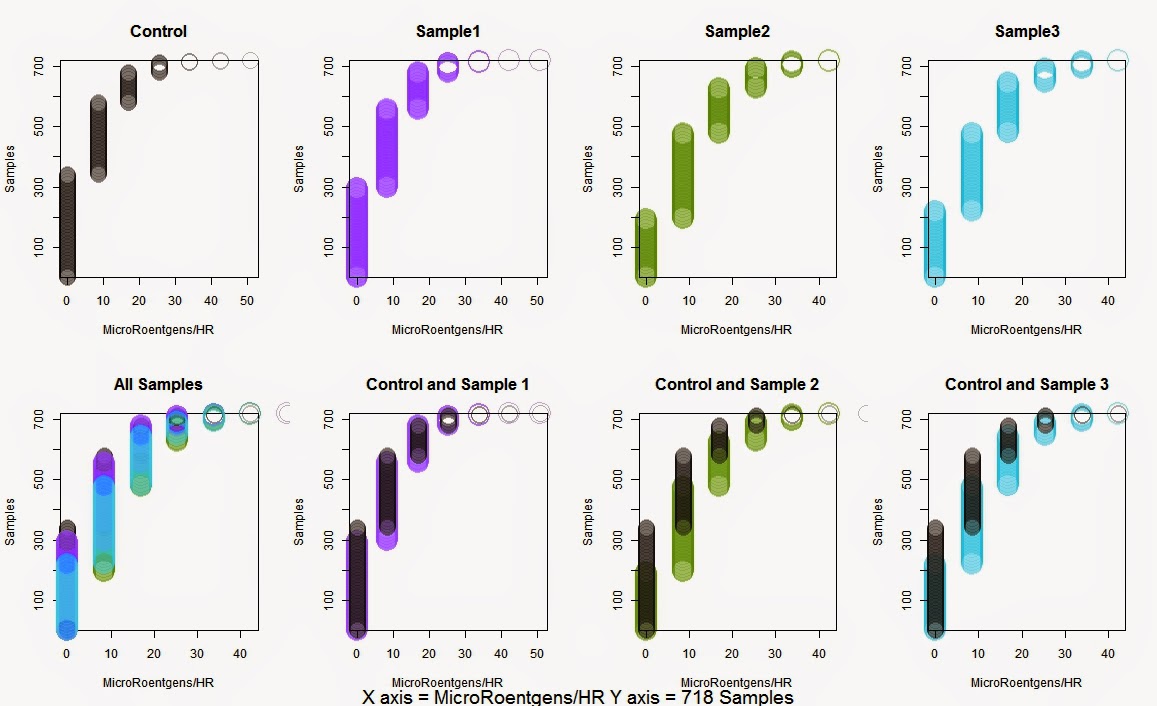
These tests represent 24 minutes of data averaged every two seconds. The RM-80 is stationary on the test substrate in all these tests. All of the tests measure the rate MicroRoentgens/HR (μ/hr) which I also identify as MicroRads_HR; although they are not quite the same thing. The first two graphs are effectively control samples. The first is the open air in my office. The second is the RM-80 filter head placed down on the shrink wrap plastic covering of a brand new filter. The last two tests are the dirty or used external filter which sits outside the fresh air intake under an external sheet metal hood. In the first of these tests (Sample 2), the used filter is covered in freezer bag; in the second test (Sample 3) the RM-80 is placed upon the used filter uncovered.
Even to the untrained eye, one can see that the used air filter is much thicker in the mid range measurements than the controls. One can get a feel for this by examining the statistics I derive from the non-zero data:
Control 718 341 8.47 50.85 6.702563 7.972580
Sample1 718 297 8.47 50.85 7.481462 7.957133
Sample2 718 194 8.47 42.37 10.467354 9.091690
Sample3 718 220 8.47 42.37 9.924708 9.029365
Because I have used code to remove zero readings in the samples above, the statistics are not evenly weighted. Here is another look from the R summary function:
s1.MicroRads_HR s2.MicroRads_HR s3.MicroRads_HR s4.MicroRads_HR
Min. : 0.000 Min. : 0.000 Min. : 0.00 Min. : 0.000
1st Qu.: 0.000 1st Qu.: 0.000 1st Qu.: 0.00 1st Qu.: 0.000
Median : 8.470 Median : 8.470 Median : 8.47 Median : 8.470
Mean : 6.703 Mean : 7.481 Mean :10.47 Mean : 9.925
3rd Qu.: 8.470 3rd Qu.: 8.470 3rd Qu.:16.95 3rd Qu.:16.950
Max. :50.850 Max. :50.850 Max. :42.37 Max. :42.370
The single 50.85 reading in both of the control group (Control and Sample1) disturbs the scale of visual comparison. However, Samples 2 and 3 (the air filter data) have less 0 measurements to begin with and their means are much higher:

The colored graph below is more complicated at first glance but designed to give the viewer some idea of how the levels compare between tests in number. The RM-80 measures radiation in levels so that the non-zero readings look like this when counted:
[1] "Sample3"
MicroRads_HR freq
1 8.47 258
2 16.95 167
3 25.42 46
4 33.90 24
5 42.37 3
By overlapping these groups as sorted frequency bins displayed by partially transparent color, we get a visual impression of the difference in profile between any two samples. In the comparison between the Control and Samples 2 and 3 (below far right), we see that the numbers for the control sample are only stronger for the zero level.
As a final test, I do row based matrix multiplication of all non zero samples and their frequencies and then add those totals. The matrix sums from the used filter samples (2 and 3) result in much greater weights:
[1] "(Matrix) Sums of row based multiplication for non zero samples."
MR.HR.Mtrx.Mult
Control 4812.44
Sample1 5371.69
Sample2 7515.56
Sample3 7125.94
This round of testing is enough to prove to myself that my filters are trapping some part of the radioactive isotopes that would be otherwise not be found in my home. The composition of those isotopes remains undefined for now.
[1] "Four samples:"
[1] "Control is Room Air."
[1] "Sample1 is a high (MERV rating) rated blank filter with metal grate still in sealed plastic."
[1] "Sample2 Tests high (MERV rating) air filter located outside 8 inch external air intake for approximately one month."
[1] "Sample2 RM80 stationary against center of filter while covered in plastic sack."
[1] "Sample3 Tests high (MERV rating) air filter located outside 8 inch external air intake for approximately one month."
[1] "Sample3 : RM80 stationary against center of filter without barrier."
[1] "Time Base Unit is 2 seconds. MicroRads_HR = microroentgens/hr"
[1] "Sample Statistics:"
Samples.V1 SampleEqZero.V1 MinNot0.V1 max.V1 mean.V1 sd.V1
Control 718 341 8.47 50.85 6.702563 7.972580
Sample1 718 297 8.47 50.85 7.481462 7.957133
Sample2 718 194 8.47 42.37 10.467354 9.091690
Sample3 718 220 8.47 42.37 9.924708 9.029365
[1] "Matrix Information for Non Zero Data"
[1] "Control"
MicroRads_HR freq
1 8.47 237
2 16.95 100
3 25.42 33
4 33.90 4
5 42.37 2
6 50.85 1
[1] "Sample1"
MicroRads_HR freq
1 8.47 259
2 16.95 122
3 25.42 32
4 33.90 6
5 42.37 1
6 50.85 1
[1] "Sample2"
MicroRads_HR freq
1 8.47 282
2 16.95 150
3 25.42 67
4 33.90 21
5 42.37 4
[1] "Sample3"
MicroRads_HR freq
1 8.47 258
2 16.95 167
3 25.42 46
4 33.90 24
5 42.37 3
[1] "Sending Four time-based Graphs of MicroRads_HR Averages Non Zero Data"
[1] "Sending Four frequency-based Graphs of MicroRads_HR Averages for Non Zero Data"
[1] "(Matrix) Sums of row based multiplication for non zero samples."
MR.HR.Mtrx.Mult
Control 4812.44
Sample1 5371.69
Sample2 7515.56
Sample3 7125.94
No comments:
Post a Comment