But this year, one narrow (981 votes) victory for Sharon Shoemake sends a lonely Whatcom Democrat to Olympia matched with Republicans Doug Ericksen and Luanne VanWerven. The Ericksen(R)/Vargas(D) contested State Senate seat which was lost by 46 votes is particularly poignant. All the more so since Pos. 2 winner Sharon Shewmake(D) had aggregated contributions and independent expenditures that were only 30% of the same for losing Senate candidate Pinky Vargas(D). Campaign expenditures were a comparatively minimal $48K for the losing Pos. 1 candidate Justin Boneau(D). Mr. Boneau lost by only 80 votes to Luanne VanWerven(R):
- 542,317 + 329,245 Contributions + Independent expenditures for Pinky Vargas
- 871,563 Vargas Total
- 190,554 + 78,808 Contributions + Independent expenditures for Sharon Shoemake
- 269,363 Shoemake Total
- 48,296 Contributions for Justin Boneau; No Independent expenditures.
This year clearly showed very high turnout in the 42nd LD. If we exempt "Challenged' and 'Undeliverable' ballots, LD 42 turnout can be described as 77% which is short of the same measure for the smaller 40th LD part of Whatcom County:
fread("WM_11.26.2018.txt")[ PrecinctID %in% p42 & (VBMReturnStatus != "Void" & VBMReturnStatus != "Challenged" & VBMReturnStatus != "Undeliverable"),.N,.(VBMReturnStatus)]
VBMReturnStatus N
1: Good 73718
2: 22777
73718/(73718 + 22777)
.7639567 # 76%
fread("WM_11.26.2018.txt")[ !(PrecinctID %in% p42) & (VBMReturnStatus != "Void" & VBMReturnStatus != "Challenged" & VBMReturnStatus != "Undeliverable"),.N,.(VBMReturnStatus)]
VBMReturnStatus N
1: Good 36739
2: 8806
36739/(36739 + 8806)
.8066528 # 80%
These numbers are ahead of the 72% state turnout figures which are probably using a slightly different measure for turnout. LD 42nd turnout did however show significant 'falloff ' for the Democrats when compared with WA U.S. Senator Maria Cantwell's same precincts in 2018. See the fourth chart far below for more insight on this.
But even if I remove the one (low vote) protected precinct (269) from Maria Cantwell's 42nd LD votes, Cantwell still had 1,564 more votes than Pinky Vargas. Sharon Shewmake had 409 more votes than Pinky Vargas. (Note that these numbers are pre-recount totals. The recount changed little. -RMF 11:05 AM 12/7/2018)
MC SS PV
37859 36704 36295
37859 - 36295
1564 # Maria Cantwell 42 LD margin over Pinky Vargas
36704 - 36295
409 # Sharon Shewmake 42 LD margin over Pinky Vargas
PrecinctSeries Shewmake Vargas diff
1: 100s 14573 14417 156 # unicorporated county
2: 200s 15372 15238 134 # Bellingham
3: 300s 1378 1351 27 # Blaine
4: 400s 378 373 5 # Everson
5: 500s 2876 2800 76 # Ferndale
6: 600s 1741 1754 -13 # Lynden
7: 700s 193 193 0 # Nooksack
8: 800s 193 169 24 # Sumas
But even if I remove the one (low vote) protected precinct (269) from Maria Cantwell's 42nd LD votes, Cantwell still had 1,564 more votes than Pinky Vargas. Sharon Shewmake had 409 more votes than Pinky Vargas. (Note that these numbers are pre-recount totals. The recount changed little. -RMF 11:05 AM 12/7/2018)
MC SS PV
37859 36704 36295
37859 - 36295
1564 # Maria Cantwell 42 LD margin over Pinky Vargas
36704 - 36295
409 # Sharon Shewmake 42 LD margin over Pinky Vargas
Precincts
Before I continue, it should be noted that the loss margin for the 42nd state senate seat was ridiculously close:
36341 - 36295 # Doug Ericksen - Pinky Vargas
46 # margin of loss
(36341+36295)
72636 # total votes for 42nd LD Senate race
round(((46/(36341+36295)) * 100),2)
0.06 # Pinky Vargas lost to Doug Ericksen by 6/100s of 1%
46/(36341+36295)
[1] 0.0006332948 # You literally can manage many complex physical processes to an acceptable accuracy with an error margin larger than this vote difference.
Sharon Shewmake's victory showed strength across all the Precinct series in LD 42nd. Pinky Vargas had only one urban area (Lynden) where she accumulated more votes than Sharon Shewmake:
PrecinctSeries Shewmake Vargas diff
1: 100s 14573 14417 156 # unicorporated county
2: 200s 15372 15238 134 # Bellingham
3: 300s 1378 1351 27 # Blaine
4: 400s 378 373 5 # Everson
5: 500s 2876 2800 76 # Ferndale
6: 600s 1741 1754 -13 # Lynden
7: 700s 193 193 0 # Nooksack
8: 800s 193 169 24 # Sumas
Precinct Charts
The charts in this post deserve a wide screen. Click to enlarge the charts.
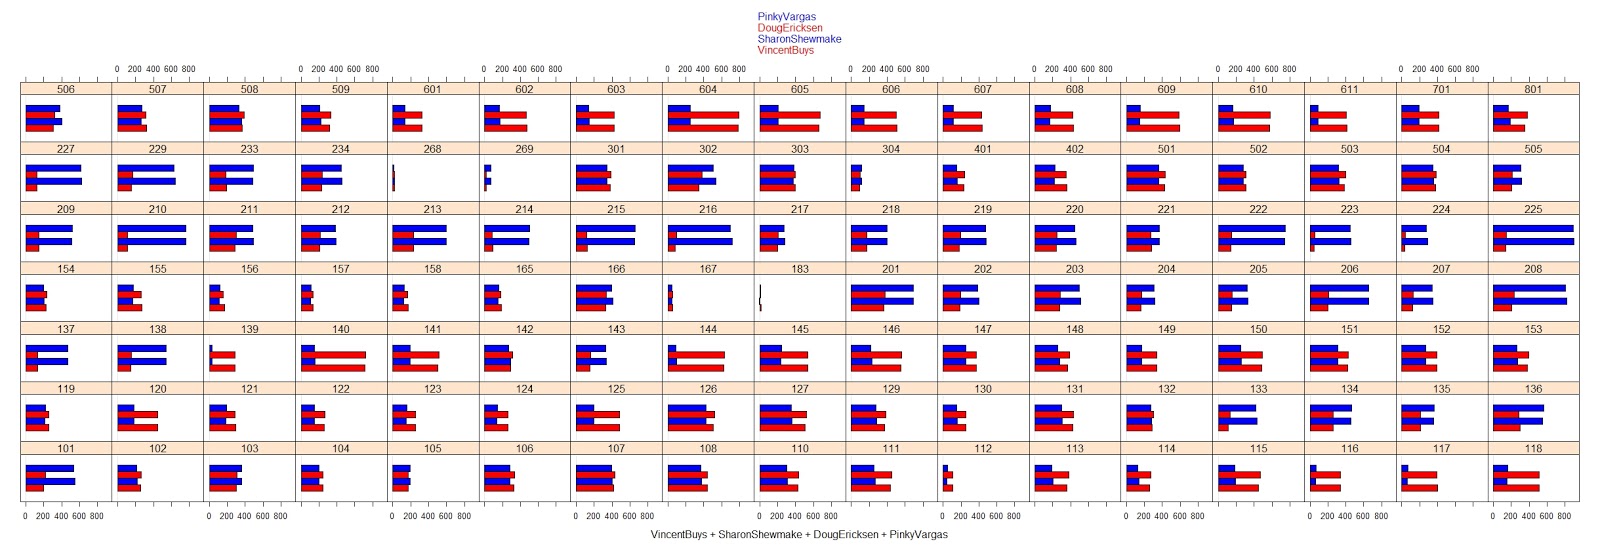 |
| Blue bars are Democrats (Pinky Vargas and Sharon Shewmake). Red bars are Republicans (Doug Ericksen and Vincent Buys). At this scale, there is a remarkable consistency between Republican and Democrat vote patterns. |
 |
| These are three Democrats (Vargas, Shewmake, Cantwell) votes for the LD 42nd. |
 |
| These two charts represents the 42nd LD precincts segregated into two groups based on SharonShewmake - PinkyVargas: SS-PV >= 1 SS-PV <= 0 Where (Sharon Shewmake - Pinky Vargas) is equal to or greater than 1, the black bars result in net votes for Sharon Shewmake. The inverse chart at bottom are the red bars (expressed as negative sums) where Pinky Vargas has more votes in those precincts than Sharon Shewmake. |
 |
| This chart gives us a metric for "precinct falloff" derived from combined Vargas/Shewmake votes over Cantwell*2. The left column represents the percentage difference (e.g. .2 is 20%) from Cantwell votes. Only the negative (red) bars show precincts where Vargas/Shewmake combined for more votes than Cantwell * 2. |
1 comment:
What was the total number of votes in the US Senate race vs the State Senate race? Did Cantwell outperform Vargas because some Ericksen voters picked Cantwell instead of Hutchison? Or are we simply seeing that some voters didn't vote for the state level contests, but did vote for federal races?
Post a Comment