[Note: The data and graphs below are the work of one [unpaid] blogger with the help of SQL Server Express, SQL Management Studio, Open Office, and Powershell. My work comes with no promises or guarantees. Please verify the data for your purposes. For my purposes, "registered voters" includes only those voters whose ballot had a disposition of some type (e.g. not a blank 'VotingMethodDesc' field) and "turn out" is defined only by a successful disposition (e.g. 'Provisional voter' or 'Voted By Mail Ballot'). See the Methodology worksheet of my data for more information. ]
"Registered Voters" and election "Turn Out" numbers in Whatcom County appear to have averaged growth more than twice as fast per year from 2005 - 2010 as the population increase (20.6%) for the last decade (2000 - 2010). Some precincts have seen over 500 new registered voters since the 2005 General Election. Whether this is more attributable to
(A)"Vote By Mail" efficiencies or
(B) the hyper-charged political climate of Bellingham and Whatcom County or
(C) urban and rural growth and annexations or
(D) all of the above,
I do not know. However, a few hours spent in SQL Server Management Studio [see spreadsheet here] demonstrates the current impressive responsiveness of the Whatcom County electorate to their civic obligation to vote:
 |
| Many precints in Whatcom County "turned out" over 70% in the 2010 General Election. |

Where have all the new registrants come from and are they voting? Yes, many of them are voting and the increases in registrants appear to be county wide. Some precincts have seen increases of 500 of more registered voters from 2005 - 2010. Many of these precincts are recent urban annexations or rural county areas. (See 1,2,3)

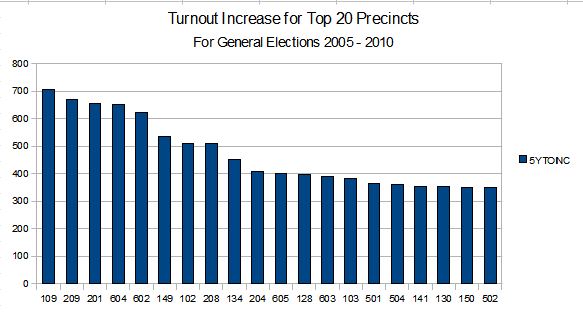
Looking below at the "Top 20 Precincts Increase in Turnout between 2005 - 2010" we see:
Precincts from Whatcom County: 109,102,149,128,103,141,130,150
Precincts from Bellingham: 209,201,208,204
Precncts from Ferndale: 604,602,605,501,504,502
[Registration Increases for 2005-2010 (REGINC5Y) and Turnout increases for 2005-2010 (TOINC5Y)]
| Bellingham | REGINC5Y | TOINC5Y | |
| totals | 12,556 | 11,290 | |
| per prec ave | 261.58 | 235.2 |
| |||||||||||||||
|

No comments:
Post a Comment