 |
| (My) Aware Electronics RM80 Geiger counter radiation testing from air filters and room fans for March to mid April 2014 from Bellingham, WA. Click to Enlarge. |
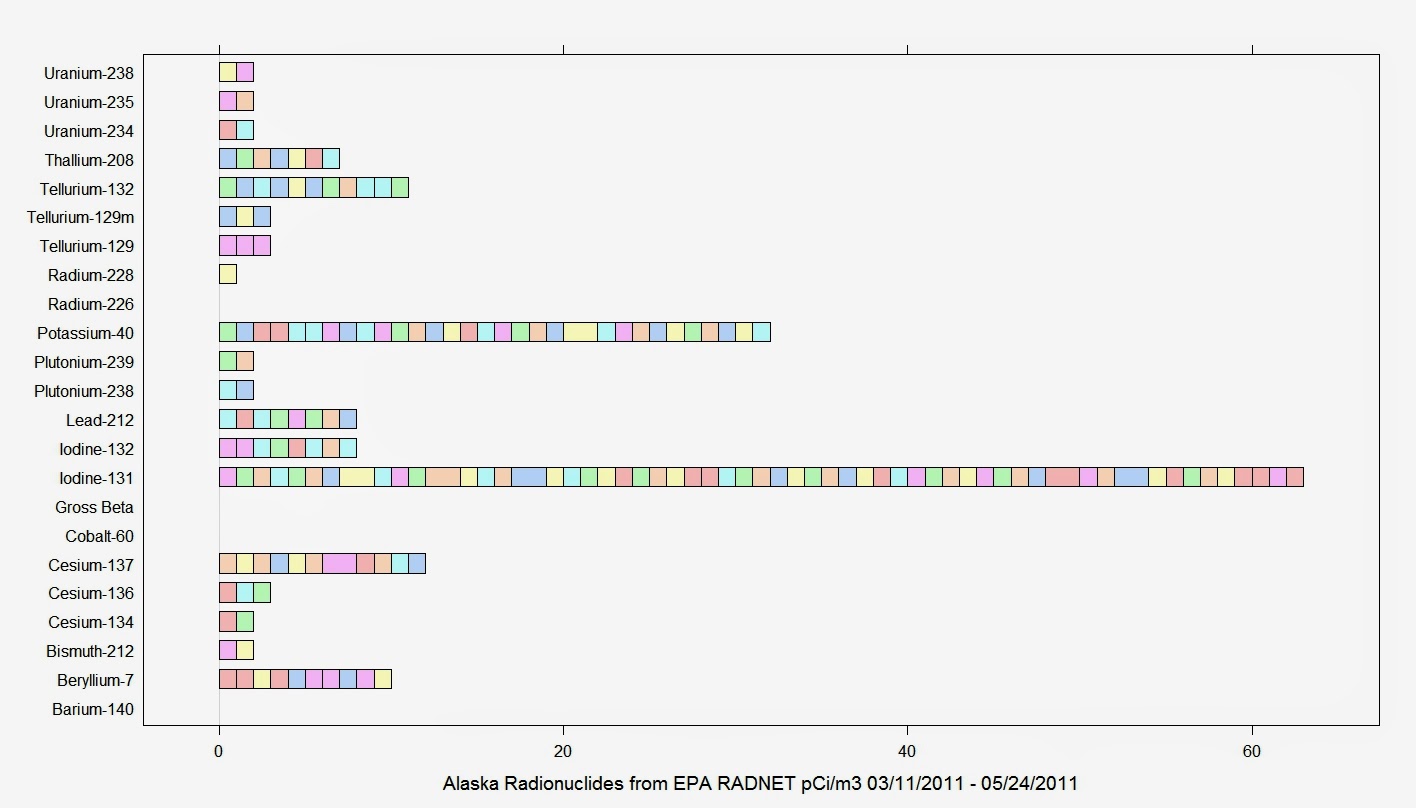 |
| A bivariate trellis ("lattice") R graph of EPA RADNET air filter measurements for Alaska cities between 3/11/2011 - 5/24/2011. Click to Enlarge.
Note: I am not a physicist, physical sciences researcher or anything of note. Just another father who wants to make sure his children aren't going to get cancer from Fukushima fallout. That's your warning to take your own samples and do your own data analysis before trusting mine.
|
Unfortunately, this difference in cost is preventing me from doing useful measurements of the effects of Fukushima in Bellingham. It looks like my air filters are showing higher than normal background radiation as measured by my Geiger-Mueller counter. But what I really want to know is what type of radionuclide is responsible for that radiation. Short lived radiation from various sources floats in the background of our lives. Some of it, if breathed in or ingested, can potentially have more devastating consequences on human anatomy than others. To get this kind of equipment, I am going to need a generous donor. If you are such a person, please contact me. R Code output for my recent measurements plus an aggregate graph is below.
 |

[1] "Four samples:"
[1] "Control is Oreck Desktop Room Filter Fan with Aware Electronics RM80 placed on exit vent."
[1] "Sample1 is taken by running RM80 evenly as possible over (removed from housing) Oreck 'MAX' room air filtration prefilter/filter."
[1] "Sample2 Tests for hot spots in high (MERV rating) air filter by running RM80 evenly and as widespread as possible. Filter is located outside 8 inch external air intake for approximately one month."
[1] "Sample2 : Both sides of filter tested while filter is encased in plastic freezer sack."
[1] "Sample3 Tests high (MERV rating) air filter located outside 8 inch external air intake for approximately one month."
[1] "Sample3 : RM80 stationary against center of filter without barrier."
[1] "Time Base Unit is 2 seconds. MicroRads_HR = microroentgens/hr"
[1] "Sample Statistics for Non Zero data only:"
Samples.V1 SampleEqZero.V1 MinNot0.V1 max.V1 mean.V1 sd.V1
Control 174 74 8.47 33.90 7.450172 8.212248
Sample1 174 51 8.47 42.37 9.349253 8.502392
Sample2 174 67 8.47 42.37 7.985862 8.185917
Sample3 174 59 8.47 33.90 9.300920 8.818765
[1] "Matrix Information for Non Zero Data"
[1] "Control"
MicroRads_HR freq
1 8.47 62
2 16.95 27
3 25.42 7
4 33.90 4
[1] "Sample1"
MicroRads_HR freq
1 8.47 75
2 16.95 33
3 25.42 10
4 33.90 4
5 42.37 1
[1] "Sample2"
MicroRads_HR freq
1 8.47 64
2 16.95 33
3 25.42 7
4 33.90 2
5 42.37 1
[1] "Sample3"
MicroRads_HR freq
1 8.47 61
2 16.95 37
3 25.42 12
4 33.90 5
[1] "Sending Four time-based Graphs of MicroRads_HR Averages Non Zero Data"
[1] "Sending Four frequency-based Graphs of MicroRads_HR Averages for Non Zero Data"
[1] "(Matrix) Sums of row based multiplication for non zero samples."
MR.HR.Mtrx.Mult
Control 1296.33
Sample1 1626.77
Sample2 1389.54
Sample3 1618.36
No comments:
Post a Comment