 |
| Currently active Whatcom County registered voters (as of May 20, 2014) profiled by Birthdate bins for the General Elections 2009 - 2013. |
This piece creates some artificial age groups from the 05.20.2014 Whatcom County (active) voter database. The charts below explicate five years of general election in Whatcom County for voters registered as of May 20,2014. This means that we are looking at election turnout numbers only for those people currently registered to vote as of May 20th, 2014. As of May 20th, the voter database for Whatcom County stood at 126283 registered voters. I present graphs with analysis. Click on these graphs to enlarge.
Whatcom County maintains an enrollment of ~30K college students (WWU, WWC, BTC, Charter College, and others) in any given school year. Primary elections here in August are often conspicuous for limited turnout. This changes in November. I suspect most students who vote don't actually switch their registration each summer. Unfortunately, I suspect they just miss the primary here and update their address electronically when they return in the fall. BTW, this is probably seen as a tragedy for the Democratic Party who I suspect would probably rather youth voted in the Summer and as well as the Fall.
I want to stop here and remind all 17 year olds that if you will be 18 this year, you may be able to register now in time to vote for both the primary and general election depending on your birthdate and your state. WA state law allows a 17 year old to register as long as they will be 18 before the next election. However, those registrations will be pended (not listed in the VRDB) until the 18th birthday of the applicant [from communications with Whatcom County Elections Staff].
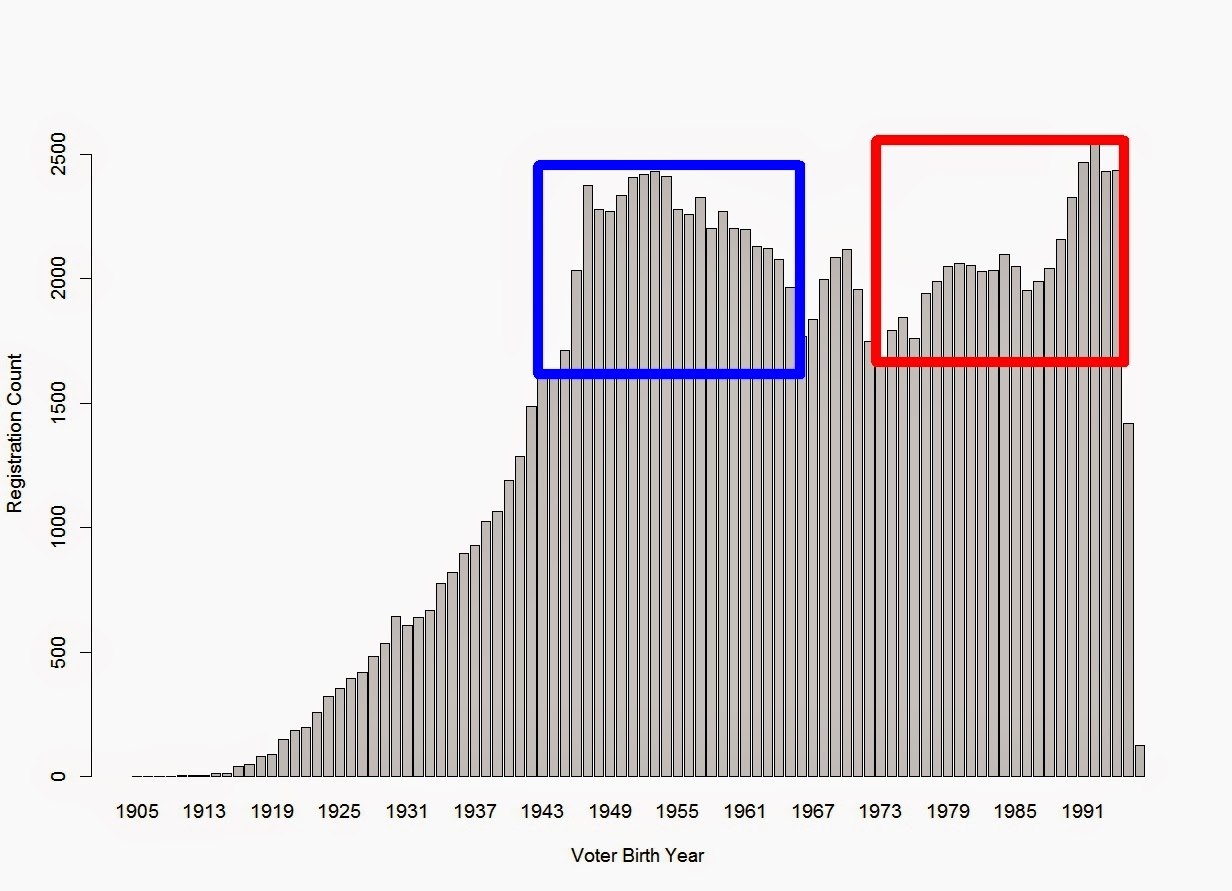
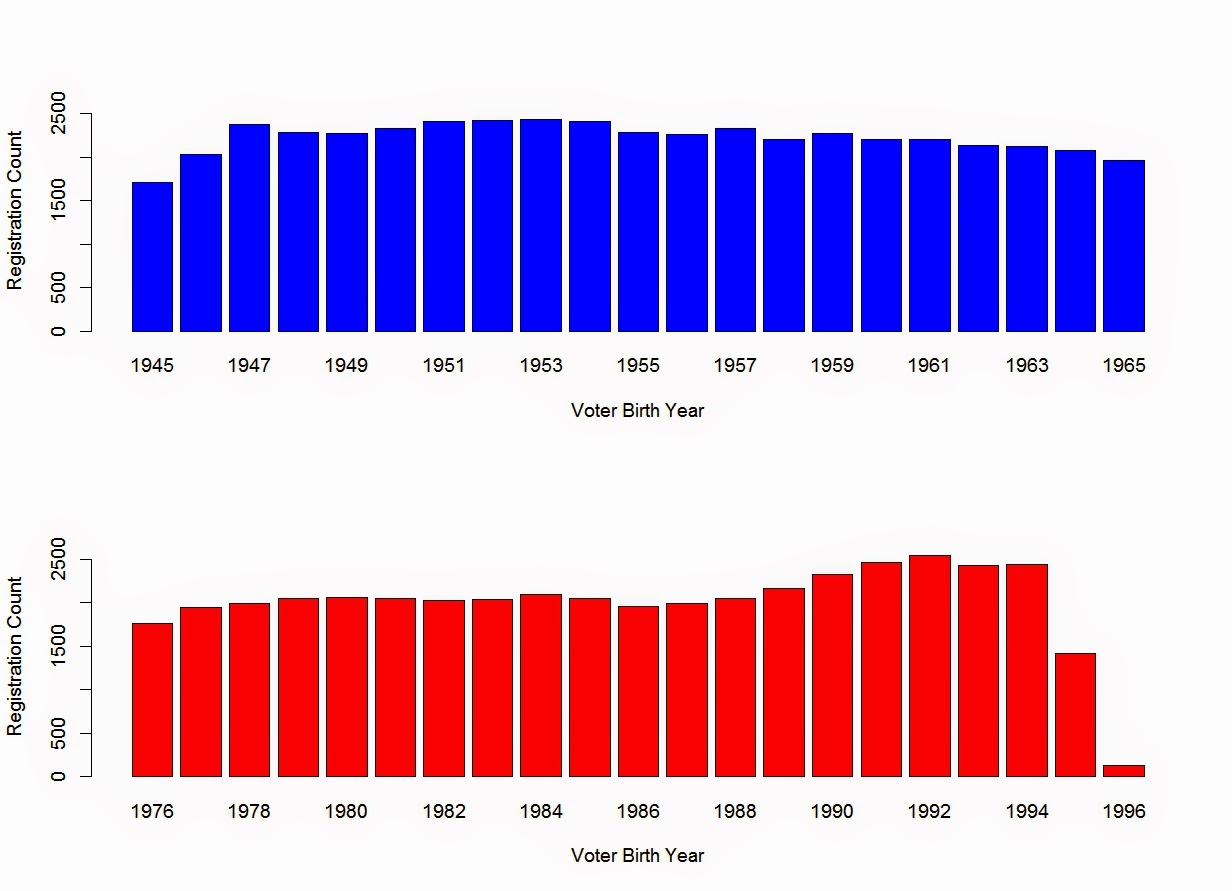
The two charts below give us age bins for each birth year of the current (05.20.2014) voter registration database. The blue and red polygons correspond to ~20 year periods of those described as "boomers" and "millenials". Note the potential variability in these artificial groups. For, example, if you were born in 1992 (voting age in 2010), you could have a father who was born in 1972, 1962, 1952. Actually, you could have had a grandfather born in 1952 (voting age in 1970), a father in 1972(voting age in 1990) and yourself (voting age in 2010). Thus three generations of voters could easily fit inside a single 'boomer to millenial' timeline. Such variability makes generalized deductions about voter behavior problematic.
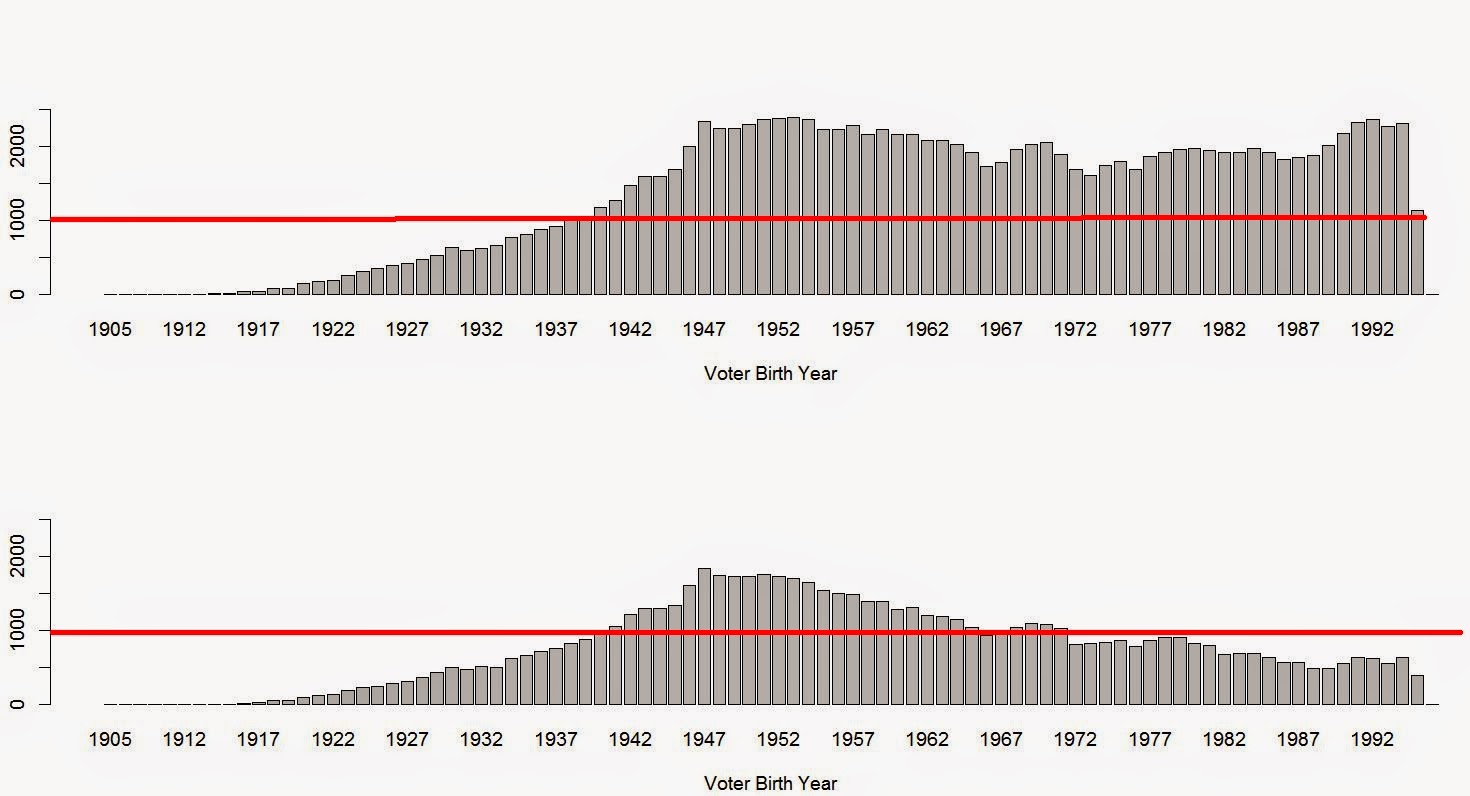
The charts below are composed of active voters as of 05.20.2014 through the years 2009 - 2013 (left to right). The charts are sorted by birthdays: registrants on bottom, those voting on top. I have drawn some red lines at the 1000 and 2000 marks. In fourth panel of the top chart (2012 General election), we can see that 'millenials' lived up to more of their promise than in the fifth panel (2013 General election).
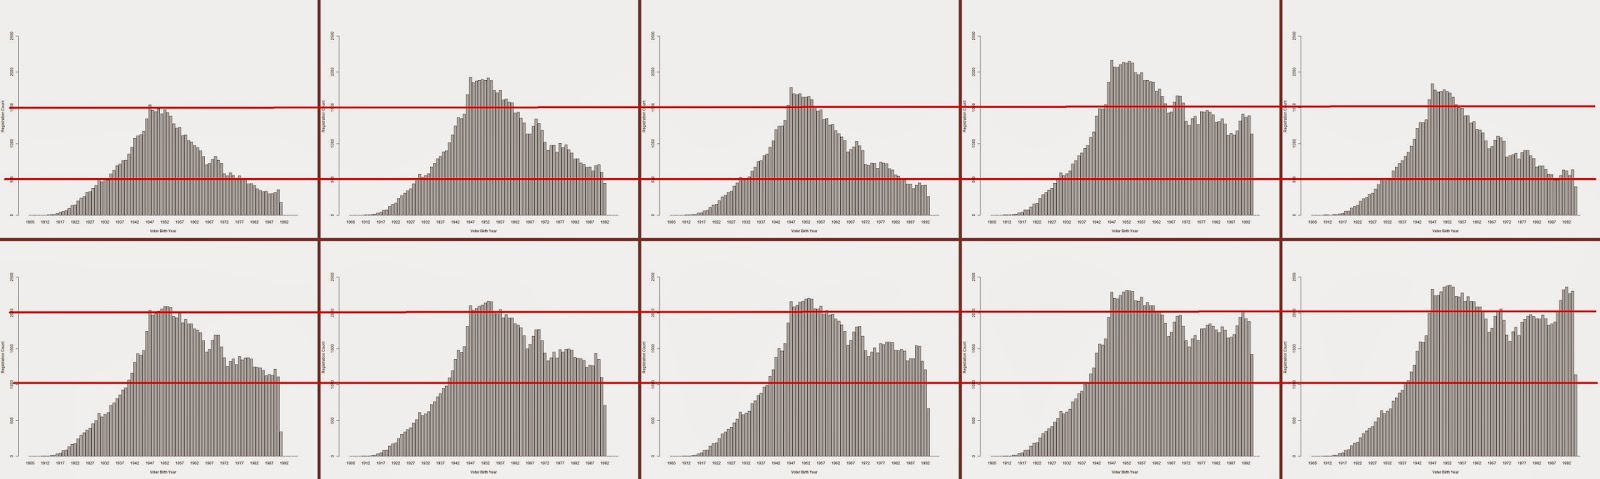
The red lines helped explain the difference between the turnout (bottom) and registration(to).
No comments:
Post a Comment