 |
| Above: A word cloud capturing the most frequent terms (greater than 1000 mentions) of the The Whatcom County Jail Press Releases for the past 4.5 years. In a word cloud analysis, a larger font equals higher term frequency. Click to enlarge all charts. |
The data below in this first part of this post comes from the collected booking records of the Whatcom County Inmate Database: Press Releases. I looked at the collected records of previous 4.5 years of this data to help me answer these questions:
- Why are citizens being booked into Whatcom County Jail?
- Who is being booked into Whatcom County Jail?
Bookings are not necessarily representative of arrests nor convictions. Conceptually, bookings are the subset in between these three terms such that Arrests > Bookings > Convictions. I used simple term counting with some normalization, text mining, word cloud analysis, and graph analysis to show relationships and frequencies. My web query routines weren't perfect enough to prevent some small amount of missing data. The terms used to describe the data and the format of those terms varied some from year to year as well. A sample of the collected raw data for 4.5 years looks like this:
"","Court","Charge","Year"
"1","LUM","ASSAULT 3 DV",2011
"2","KIN","FTA CONT SUB FALSE INFO",2011
"3","WHD","FTA ASSAULT 4",2011
"4","WHD","FTA DWLS 3",2011
"5","WHD","DWLS 3",2011
"6","WHD","ASSAULT 4TH DV X2",2011
"7","S37","FTA PROB VIOL FEL HARAS DV",2011
"8","FEM","DWLS 3",2011
"9","S13","FTA POSS CONT SUB COCAINE",2011
"10","WHD","DUI",2011
My lexical analysis below uses the the "Charge" column. I have written text substitution routines that normalize the raw data variations of {1,2,3,4} such that 1st,1ST,2nd, 2ND,3rd,3RD,4th,4TH become strictly numeric. Also the variations of {ASSAULT} including "ASLT", "ASSLT" are normalized. A simple word count/ranking of the various charge types is only so useful because of the numerous wordings in the press releases for similar charge categories:
Charge n
1 DUI 4787
2 FTA DWLS 3 2021
3 DWLS 3 1288
4 ASSAULT 4 1262
5 ASSAULT 4 DV 964
6 DOC DETAINER 856
7 DWLS 3 DEGREE 806
8 FTA THEFT 3 691
9 THEFT 3 689
10 DOC SEC WAR 654
.. ... ...
After normalizing some search terms, a search for arbitrary terms gives us a better idea of the most frequent terms used in booking charges. Here are the top 12 terms followed by a brief lexicon:
Category Charge Term
1 FTA 12467
2 DUI 6450
3 DWLS 6359
4 ASSAULT 5286
5 THEFT 3553
6 VIOL 3280
7 BURGLARY 3280
8 CONT 3072
9 DOC 2759
10 ORDER 1980
11 ROBBERY 1980
12 DRUG 1171
...
FTA = Failure to Appear (e.g. in court )
DUI = Driving Under Influence (drugs or alcohol)
DWLS = Driving With License Suspended (1st through 3rd degrees)
CONT = controlled (e.g. 'controlled substance')
VIOL = a violation of a court order or parole mandate (e.g. 'VIOL NCO')
ASSAULT = In WA, this is an RCW defined crime with four degrees
DUI = Driving Under Influence (drugs or alcohol)
DWLS = Driving With License Suspended (1st through 3rd degrees)
CONT = controlled (e.g. 'controlled substance')
VIOL = a violation of a court order or parole mandate (e.g. 'VIOL NCO')
ASSAULT = In WA, this is an RCW defined crime with four degrees
We can use a similar strategy to break down a particular charge into subcategories by percentage:
Category Charge PCT
1 ASSAULT4 3475 72.41
2 ASSAULT2 627 13.07
3 ASSAULT3 557 11.61
4 ASSAULT1 140 2.92
Or we can choose an arbitrary set of terms to designate a group of crime (e.g. 'Violent Crimes') Notice that a count of these terms equals only 2.13% of all charge terms for the 4.5 year period (2011 - 2015).:
Category Charged
1 ASSAULT2 627
2 RAPE 194
3 ASSAULT1 140
4 MURDER 36
5 HOMICIDE 14
6 MANSLAUGHTER 5
scales::percent(sum(627,194,140,36,14,5)/nrow(Crimes))
[1] "2.13%"
In a post to follow, I document two large scale "criminogenic cycles" of related charges ('DUI/DWLS' and 'ASSAULT 4/VIOL NCO') that I believe are responsible for most of Whatcom County Jail bookings. Here is a "text mining" term relationships graph for all term mentions over 2000 for the 4.5 year period. The thicker the line between terms, the more frequently those terms exist together in the same booking charge description in the press releases.Click to enlarge all charts.

A visual inspection shows that DUI and DWLS almost eerily correlate numerically each year in term counts. Numerically that correlation is nearly 1!! Wow....
with(Alld,cor(DUI,DWLS))
[1] 0.9731963
Here's what a chart of that relationship looks like over time:
 |
| Above: DUI vs DWLS bookings with FTA included. Below: DUI vs DWLS bookings without FTA ("Failure To Appear"). Doubled projections for the 2015 half year would show an uptick in non FTA bookings for both DUI and DWLS.  |
Each year, the term collection of one of these four terms ("DUI", "DWLS", "ASSAULT", "VIOL") creates a count that appears in 42 - 49 percent of all booking charges for the year:
Year DUI DWLS ASSAULT VIOL Total PCT
1 2011 1702 1874 1319 668 11333 49
2 2012 1521 1523 1077 417 9650 47
3 2013 1415 1341 1012 496 9577 45
4 2014 1089 912 1116 1066 10520 40
5 2015 723 709 762 633 6652 42
ASSAULT and VIOL terms clearly don't correlate so highly as DUI and DWLS. Let us look at just ASSAULT4 with all lexical forms of no contact violations that I can find:
Year ASSAULT4 VIOLNCO VIOLNoContactOrder VIOLProtectionOrder Total PCT AllNCO
1 2011 845 205 6 17 11333 9.5 228
2 2012 683 143 12 19 9650 8.9 174
3 2013 657 143 33 26 9577 9.0 202
4 2014 786 0 194 119 10520 10.4 313
5 2015 504 0 133 122 6652 11.4 255
ASSAULT4 and AllNCO still don't create a high correlation:
with(Allz4,cor(ASSAULT4,AllNCO))
[1] 0.1508041
But a visual inspection of ASSAULT4 and the collection of all terms for various types of no contact orders reveals a time series relationship. Click to enlarge all charts:


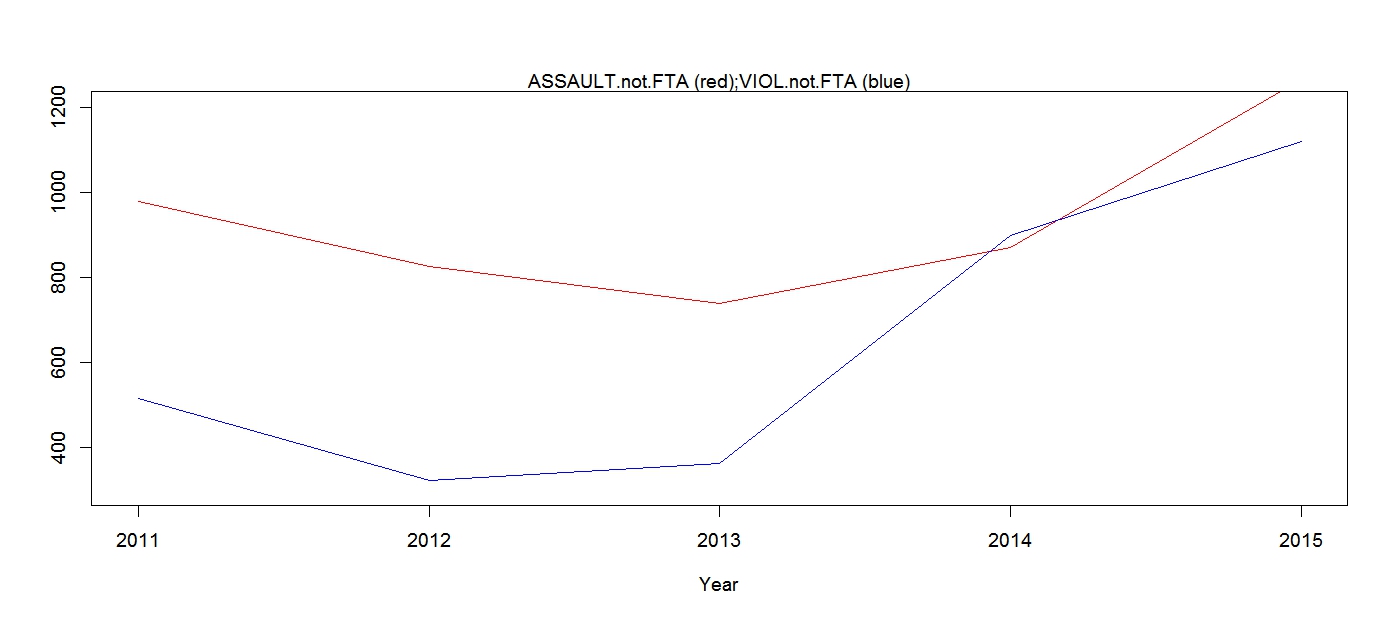
"FTA" is "Failure to Appear". The columns below come from term search where DUI /DWLS/ASSAULT/VIOL appears with or with not FTA in the charge:
DUI.DWLS
Year DUI DUI.not.FTA DWLS DWLS.not.FTA
1 2011 1702 1343 1874 742
2 2012 1521 1199 1523 619
3 2013 1415 1162 1341 550
4 2014 1089 984 912 640
5 2015 723 723 709 709
ASSAULT.VIOL
Year ASSAULT ASSAULT.not.FTA VIOL VIOL.not.FTA
1 2011 1319 978 668 517
2 2012 1077 826 417 323
3 2013 1012 738 496 363
4 2014 1116 871 1066 898
5 2015 762 632 633 560
A 'word cloud' below based on terms found more than 100 times in 4.5 years. Click to enlarge all charts:


In the charges, contractions for 'dv' ("domestic violence"), possession ("poss"), 'controlled ("cont") substance ("sub")', and 'malicious mischief' ("mal", "misch") show up both for terms with greater than 1000 and 1500 hundred mentions. Terms like possession, controlled, drug, theft are signaling drug use arrests in Whatcom County. Other terms: 'INV' = investigation, 'FTA' = 'failure to appear'.


This is some preview data for a post to follow on race and incarceration in Washington and Whatcom County. 'POC' is my total for "People of Color" (e.g. Black, Hispanic,NatAmerican,Other). 'UnRace' is race marked as "unknown". Data is from WASPC.
[Average Daily Pop for Whatcom County Jail 2010 - 2014]
Jail Year White Black Hispanic NatAmerican Other UnRace POC
57 Whatcom 2014 251 21 0 65 6 65 92
117 Whatcom 2013 281 22 31 73 3 4 129
177 Whatcom 2012 303 27 36 87 5 4 155
237 Whatcom 2011 274 24 31 85 5 4 145
297 Whatcom 2010 304 22 26 78 4 NA* 130
[Summed Average Daily Pop for all WA Jails 2010 - 2014]
Year White Black Hispanic NatAmerican Other UnRace POC
1 2014 8642 1924 849 604 408 202 3785
2 2013 8330 1857 557 575 378 517 3367
3 2012 8695 1945 403 585 398 579 3331
4 2011 8698 2061 666 607 415 328 3749
5 2010 8113 1889 1721 535 481 NA* 4626
*Unknown Race category was not collected in 2010
5 comments:
Thank you for taking time to do this, Ryan. I know how challenging it is to get good data, at least from Whatcom County. They are not very forthcoming, and it is challenging when they change data in different places...so normalizing information is helpful.
Question for clarification only...when you cite "Average Daily Population" do you know if they are speaking only of downtown, or of downtown plus division street? And do you know if they also count those who are out on Electronic Home Detention - where they are not housed in the Work Release...they just check in there?
Just curious if you happened to find that out.
Joy
Joy:
Good Catch. These numbers for Whatcom County are ~400 pop, this must just be for those incarcerated in County Jail. There is data for the work release I have seen. I will look for it. I haven't run across any home detention data. I will look for that as well.
Thanks,
Ryan
Thanks to you for trying to get this and trying to analyze it. It is incredibly useful to see how you are analyzing the data you get, for you see things I don't know to look for, or look at. So I am learning from how you present what the different things mean. It is challenging when we are not trained to see stats the way you can...so helping us see what the stats mean or indicate is the critical things for us readers.
Believe me, I do sympathize with the challenges you have. I know it is really frustrating to report certain data. I was hoping you had some magic source of data that would tell us these figures, for the challenging thing here has been that the figures we have been able to get change in different spots, so that it could never be pinpointed what the population honestly is. We could not identify a baseline.
And since I am not a stats professional, I have no reference point to know if I was missing something - and I was hoping you had found a different source to work from that was clear about these things.
Here is why I am questioning and asking clarifying root data questions:
The Restorative Community Coalition had a really smart college intern who was graduating with a statistical analysis background try to get good numbers for us. She reported to me, and as she emailed and met with Wendy Jones (the head of the jail) over several weeks of communication - she got very frustrated for she could not get good data, and certainly not in any timely manner. She finally got a stats sheeet from Wendy, and ended up reporting at the end of her internship that some critical records were just not kept, that some stats were supposed to be kept by a different department but that department did not have them, and that some stats were reported to the state, but they were not congruent either. She was told that perhaps the Prosecutor's office tracked other data. But under inquiry, they didn't.
This Intern was terribly frustrated at the run-around and at the lack of critical data she felt should have been available. What is interesting is that the data our Intern got was different than what Wendy would then say at different meetings later. It was not the same as what we got from the state records, and it was different than what they delivered in the inadequate Jail Capacity Needs Document that the planners ultimately (and at the last minute) included in the Final Environmental Impact Statement. None of this data seemed to be cross checked, fact checked or reviewed or discussed in any public hearing - so we could not get a solid bead on anything.
Sidenote: Ultimately, the Council received a briefing on the FEIS November 12, 2013 where they were told by the Jail Planners and Executive Louws that the FEIS they got delivered the prior Friday was complete, and that legally no further public hearings were needed to buy the land in Ferndale, and that the option to purchase that land was running out and that it had to be bought within 10 days from the prior Friday (by next week), or Jack said the price would double. All of that is on record.
Back to the numbers. We found that not only could we not get good stats from the head of the jail, then we found that the numbers that the Sheriff would then quote were a moving target as well. They would range from the two hundred figures to the four hundreds depending on what point he was trying to make at any given time. He would define the numbers in many different phrases...so it was inconsistent information that never could be accurately added up. This leaves the listener often feeling stupid, when we are not. The information given kept changing form.
What made it most confusing was sometimes he/they would say it was the average daily population, sometimes it was the number of bookings in a day, sometimes it was the average jail bed stays, and sometimes it was the number of people in jail today, sometimes it seemed like he was talking about downtown to illustrate how overcrowded downtown was, but then he would used a stat that included Division street too. The question asked was always similar...the answers given were never congruent, and never given with a source. Which jail and how many were staying overnight vs how many were on home detention and just checked in daily could not seem to be determined. That is why I am curious as to what you find out.
That is why I have been so clear that there is No Needs Assessment that establishes any basis for discussion about justification for the jail in the first place.
So far as I can find, they have never established a baseline that is fully accurate and cohesive or verifiable. At least it has not been delivered anywhere...and I have asked for it. The Coalition has asked for it. The Jail Task Force asked for it. The public paid $2 Million dollars to get it - for it forms the foundation upon which all other planning must rest - and they promised to deliver it to the taxpayers. The County Council has asked for it. The Bellingham City Council has asked for it. There are references made that it is done - but there has been no completed Needs Assessment.
Jack says he has it when he gives presentations, but it is not there. And in the Final EIS on the Summary page 7 - upon which they base their entire proposed .02% sales tax initiative to build an overzealous $132.5 Million dollar regional jail plan, they say, and I quote:
"Several comments were received regarding the Needs Assessment, including assumptions used, errors, data accuracy, etc. All comments were forwarded to the Needs Assessment authors. This EIS, however, uses the final conclusions on capacity, facilities and the existing environment to evaluate impacts. With a proposed bed capacity of 521 and design features of the Sheriff's Headquarters and other facilities, the EIS scope is assumed to be correct."
Yet inside this FEIS report the Jail Planners disclaim responsibility themselves for the data they provide. They declare hundreds of public questions to be outside the scope of the jail plan. They put the Council in the liability seat. And in testimony they tell the Council that no public hearings are needed. Yet so far as I can deduce, it is all based on moving data that is not justifiable.
Truly, Ryan, if you can get us some good baseline stats to work with, you will be our super hero. And analyzing the stats you get so that laymen can understand what they mean is an extremely valuable service...you are a blessing. Thank you from the bottom of my heart. Thank you also for all of those in the "silent silo" - those who cannot speak out.
Post a Comment