Updated 2/10/2016: All School and Fire levies pass. 32% turnout with 40K voting.
Today (February 9th) there is a special election for school and fire district financing throughout the county ... Remember to Vote. Drop Boxes are placed throughout the county. If you mail your ballot, it must be postmarked (with stamp) by February 9th. If you are around downtown Bellingham, there will be a drive through drop box near the court house open until 8 p.m. You can check your voter status, update your address, or register to vote online in WA at MyVote.wa.gov . Some Charts from the 2015 Election are below the break.
Click on all the charts to enlarge. R 3.2.2 Code is
here. The 3D chart below looks at five races segregated by 'arbitrary' precinct groupings: 100 series (County), 200 series (Bellingham), 300 - 900 series (Small Cities). The race pairs are listed left to right.
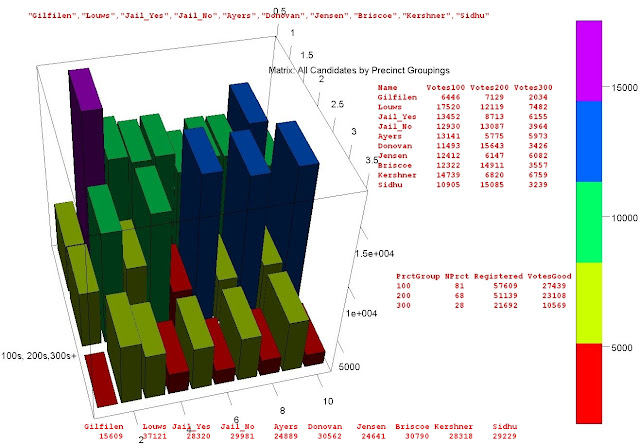
The 3D Chart below gives us the totals for the four candidate races referenced above (not including the Jail Bond) aggregated red (left) vs. blue (right) rows as below.
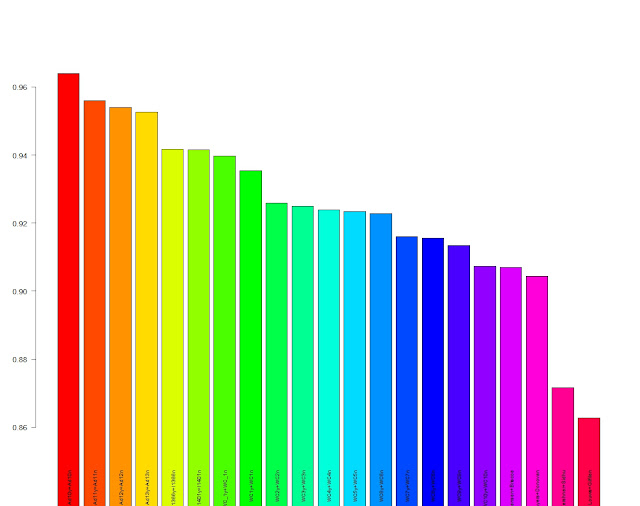
The chart below gives the "falloff" for 21 (all county) races or the percentage of "Ballots Good" that voted for particular candidates/issues. The second green column is the Jail Bond (seven from left). Not that the last column (bright red) is the Executive race:
Precincts numbers are non sequenced numeric factors that run from 101 - 801. If we sort those precincts numerically and then group them by 10, the difference between the Democrat sums and Republican sums for four races (from above) would look as below. For precinct reference the 100 series (County): 1 - 81; the 200 series (City) : 82 - 149; the 300 - 900 series (Small City) : 150 - 177.
3D perspectives that compare and contrasts matrices for (left to right) Jail Bond, Executive, Jail - Candidate matrix:
Top graph: Votes by precinct against the Jail Bond but not for Joy Gilfilen (approx ~14K).
Bottom graph: Votes by precinct for the Jail but not for Jack Louws (approx ~8K). These charts have been trimmed/normalized to remove high and low points.
The abstraction below aggregates precincts who had similar levels of "votes (ballots) good" into buckets and then gives us Jack, Joy, good (ballots) , registered totals aggregated for those buckets.
A couple of very dense charts to conclude, just because you got this far.... ;-)


No comments:
Post a Comment