Translate

Thursday, June 28, 2018

"2018" CVAP Data and graphs. Part I

Below are lattice (trellis) graphs of CVAP data from https://www.census.gov/programs-surveys/decennial-census/about/voting-rights/cvap.html. See technical documentation here.  This is the latest Citizen Voting Age Population for WA state by county and "lower house" legislative districts. Below the break are (4) charts for Counties and (5) charts for LD that describe:
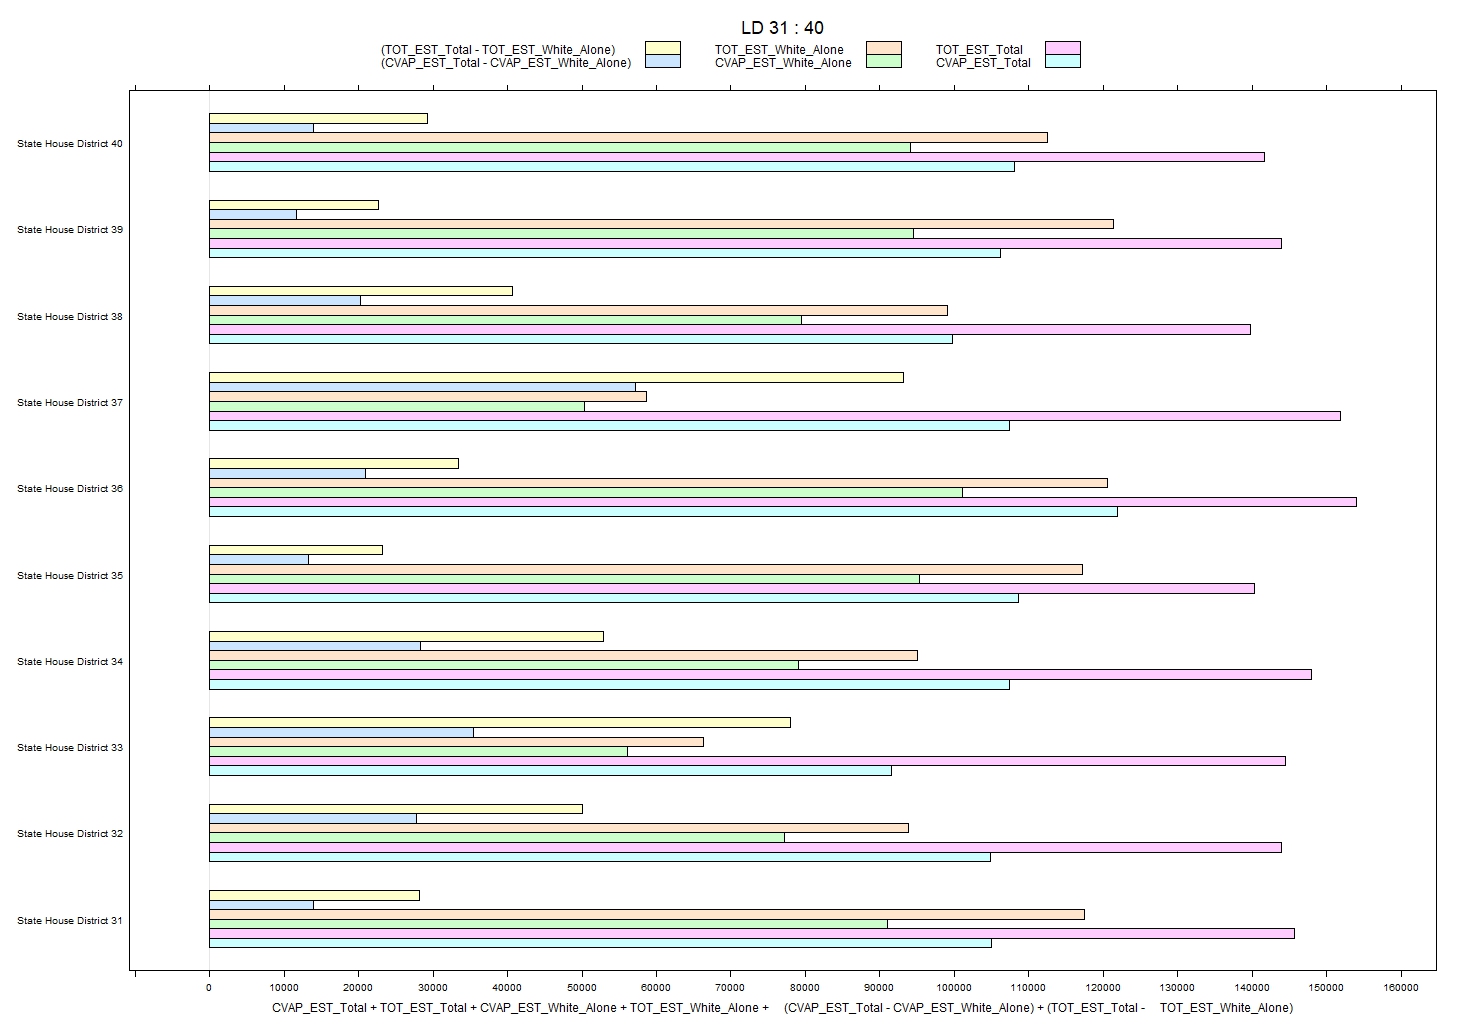
  • CVAP_EST_Total # Citizen Voting Age Population Total per County or LD.
  • TOT_EST_Total   # Total estimated population per County or LD.
  • CVAP_EST_White_Alone  #  Citizen Voting Age Population for race "White Alone".
  • TOT_EST_White_Alone     #  Total estimated "White Alone" population.
  • (CVAP_EST_Total - CVAP_EST_White_Alone)  # The remaining CVAP not "White Alone".
  • (TOT_EST_Total - TOT_EST_White_Alone)       # The remaining population not "White Alone. 
Because the charts are detailed, there is a zip and 7zip file with spreadsheets and jpgs here. The data fields for county and legislative districts are as below.

t(rbind(County[1],SLDL[1]))

         [,1]                      [,2]                                    
GEONAME  "Autauga County, Alabama" "State House District 1 (2016), Alabama"
LNTITLE  "Total"                   "Total"                                 
GEOID    "05000US01001"            "62000US01001"                          
LNNUMBER "1"                       "1"                                     
TOT_EST  "55050"                   "46015"                                 
TOT_MOE  NA                        "1138"                                  
ADU_EST  "41195"                   "36130"                                 
ADU_MOE  " 34"                     "856"                                   
CIT_EST  "54510"                   "45450"                                 
CIT_MOE  " 263"                    "1115"                                  
CVAP_EST "40690"                   "35660"                                 
CVAP_MOE "236"                     "851"


LNTITLE covers the following racial/ethnic classifications:

 SLDL[,.(LNTITLE=unique(LNTITLE))]
                                                           LNTITLE
 1:                                                          Total
 2:                                         Not Hispanic or Latino
 3:                         American Indian or Alaska Native Alone
 4:                                                    Asian Alone
 5:                                Black or African American Alone
 6:                Native Hawaiian or Other Pacific Islander Alone
 7:                                                    White Alone
 8:                     American Indian or Alaska Native and White
 9:                                                Asian and White
10:                            Black or African American and White
11: American Indian or Alaska Native and Black or African American
12:                        Remainder of Two or More Race Responses
13:                                             Hispanic or Latino 

 For more information, please see technical documentation. Click on charts to enlarge.

Counties


Legislative Districts


No comments: