 |
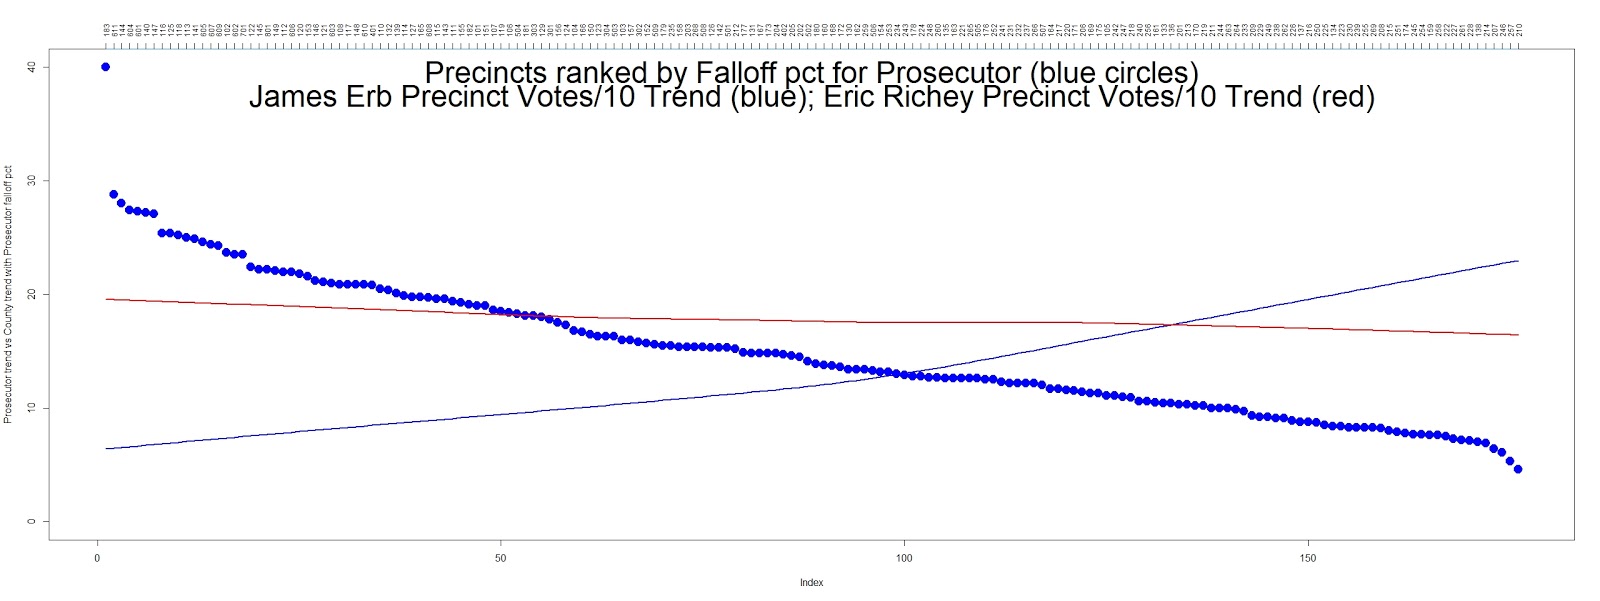
| James Erb ~8K loss to Eric Richey in the primary was distributed by falloff percentage across many precincts. In the chart above,there were ~4K less votes in the Prosecutors race vs. the County at Large Race. In the chart below, the ('lowess') trend line representing James Erb precinct votes increases dramatically as precinct falloff in the Prosecutor's race decreases. Votes are scaled by dividing by 10 to match the 'falloff percentage". Click to enlarge the graphs. |
Introduction
Technical appendices exist to this post covering data sources and the concepts of voter falloff, correlation and similar populations. The data for this post can be found here. The Richey vs. Erb (Prosecutor race) primary shows correlations and falloff in patterns much different to the other races in Whatcom County, especially the County at Large race which has a voting population with comparable measures of variance. The precinct correlations and falloff in the Prosecutor's race deserve greater analysis. The "all county" races in the Whatcom County 2018 primary gathered their shares of the nearly ~ 63K votes for the following candidates:
EricRichey,JamesErb
# Prosecutor
[1] 53385
TomSeGuine,CecilyHazelrigg-Hernandez,LisaKeeler,RogerLeishman,RitaLatsinova
# Judiciary
[1] 54466
CarolFrazey, MikePeetoom, AaronThomas,EricBostrom
#County at Large
[1] 57028
The race votes divided up as below, with Democrats essentially holding the recently established 3:2 all county edge for the County at Large, Judicial, and Prosecutor races. But for the Prosecutor race, we have two Democrats of which James Erb was endorsed by the Whatcom Democrats:
EricRichey,JamesErb # Prosecutor
RaceTotals
1: 30940 D
2: 22445 D
CarolFrazey,AaronThomas,MikePeetoom,EricBostrom
#County at Large
1: 23985 D
2: 10954 D
3: 13956 R
4: 8133 R
The judiciary race is non-partisan (and spanned four counties), however some preferences could be assumed as below based upon ... generally accepted rumors (?). Cecily Hazelrigg-Hernandez was endorsed by the Whatcom Democrats. Whatcom County totals were:
TomSeGuine, CecilyHazelrigg-Hernandez, LisaKeeler,RogerLeishman,RitaLatsinova
# Judiciary [non partisan]
RaceTotals
1: 13721 [R]
2: 14724 [D]
3: 13012 [D]
4: 5365 [?]
5: 7644 [?]
# Judiciary [non partisan]
RaceTotals
1: 13721 [R]
2: 14724 [D]
3: 13012 [D]
4: 5365 [?]
5: 7644 [?]
For the rest of this post I will compare the Whatcom County Council at Large race with the Prosecutor's race.
Correlation Coefficients
Both Eric Richey and James Erb ran as Democrats. However, Richey's precinct totals correlate with Republican's Eric Bostrom and Mike Peetoom whereas Erb's precinct totals correlate strongly with left leaning candidates Carol Frazey and Aaron Thomas.
EricBostrom 0.75 -0.04
EricRichey 1.00 0.43
JamesErb 0.43 1.00
CarolFrazey 0.47 0.93
MikePeetoom 0.59 -0.30
AaronThomas 0.35 0.87
[cor matrix]
EricBostrom EricRichey JamesErb CarolFrazey MikePeetoom AaronThomas
EricBostrom 1.00 0.75 -0.04 -0.05 0.74 -0.08
EricRichey 0.75 1.00 0.43 0.47 0.59 0.35
JamesErb -0.04 0.43 1.00 0.93 -0.30 0.87
CarolFrazey -0.05 0.47 0.93 1.00 -0.33 0.74
MikePeetoom 0.74 0.59 -0.30 -0.33 1.00 -0.33
AaronThomas -0.08 0.35 0.87 0.74 -0.33 1.00
n= 176
Despite their nearly ~4K population size difference, many of the precinct measures of variances for Prosecutor and County voting populations (p1,p2) imply similar populations
names data
1: sum.p1 53385
2: sum.p2 57028
3: mean.p1 303
4: mean.p2 324
5: median.p1 308
6: median.p2 330
7: sd.p1 112 # standard deviation
8: sd.p2 114
9: var.p1 12538 # variance
10: var.p2 12966
11: mad.p1 104 # median absolute deviation
12: mad.p2 110
13: t.test_p.value 0.08640847 # standard t-test in r
14: t.test_statistic -1.719496
15: prop.test_p.value 0.9999985 # assess null proportions
16: prop.test_statistic 101.0407
17: var.test_p.value 0.8244875 # F-test in r
18: var.test_statistic 0.9669792
The Prosecutor's race suffers the highest falloff rates in the most conservative precincts. Erb's votes are especially low here, but even in precincts where Erb manages triple digits, the falloff rates for prosecutor are high, often double the County at Large falloff rates:
PrecinctID EricRichey JamesErb Prosecutor County Falloff_Prosecutor Falloff_County P
1: 183 3 3 6 9 40.0 10.0 red-blue
2: 611 161 54 215 275 28.8 8.9 red
3: 144 258 64 322 397 28.0 11.2 red
4: 604 273 92 365 451 27.4 10.3 red
5: 601 160 48 208 246 27.3 14.0 red
6: 140 282 76 358 445 27.2 9.6 red
7: 147 162 107 269 329 27.1 10.8 red
8: 116 158 33 191 239 25.4 6.6 red
9: 125 189 64 253 305 25.4 10.0 red
10: 118 189 75 264 318 25.2 9.9 red
11: 113 182 64 246 292 25.0 11.0 red
12: 141 206 87 293 357 24.9 8.5 red
13: 605 321 106 427 497 24.6 12.2 red
14: 607 184 51 235 296 24.4 4.8 red
15: 609 254 70 324 386 24.3 9.8 red
16: 102 152 93 245 286 23.7 10.9 red
17: 602 215 75 290 338 23.5 10.8 red
18: 701 165 70 235 268 23.5 12.7 red
19: 122 133 65 198 233 22.4 8.6 red
20: 145 257 97 354 405 22.2 11.0 red
21: 801 133 63 196 229 22.2 9.1 red
22: 149 150 61 211 242 22.1 10.7 red
23: 112 53 18 71 79 22.0 13.2 red
24: 606 240 76 316 358 22.0 11.6 red
25: 120 218 58 276 320 21.8 9.3 red
26: 153 163 123 286 330 21.6 9.6 red
27: 146 276 91 367 436 21.2 6.4 red
28: 121 142 82 224 257 21.1 9.5 red
29: 603 168 50 218 252 21.0 8.7 red
30: 108 201 132 333 372 20.9 11.6 red
31: 117 167 45 212 250 20.9 6.7 red
32: 148 162 129 291 326 20.9 11.4 red
33: 610 298 84 382 437 20.9 9.5 red
34: 401 122 42 164 181 20.8 12.6 red
35: 110 209 124 333 378 20.5 9.8 red
36: 132 149 89 238 258 20.4 13.7 red
37: 139 111 16 127 148 20.1 6.9 red
PrecinctID EricRichey JamesErb Prosecutor County Falloff_Prosecutor Falloff_County P
By comparison, where the falloff rates are lower, Erb does much better. These are bluer precincts:
PrecinctID EricRichey JamesErb Prosecutor County Falloff_Prosecutor Falloff_County P
1: 211 231 139 370 376 10.0 8.5 red-blue
2: 244 199 206 405 419 10.0 6.9 blue
3: 263 105 238 343 352 10.0 7.6 blue
4: 264 192 208 400 408 9.9 8.1 blue
5: 233 216 166 382 398 9.7 5.9 blue
6: 209 181 236 417 417 9.3 9.3 blue
7: 229 154 173 327 330 9.2 8.3 blue
8: 249 225 221 446 455 9.2 7.3 blue
9: 238 172 99 271 274 9.1 8.1 blue
10: 262 160 190 350 362 9.1 6.0 blue
11: 226 107 117 224 228 8.9 7.3 blue
12: 137 164 188 352 363 8.8 6.0 blue
13: 216 196 294 490 500 8.8 6.9 blue
14: 250 254 321 575 577 8.7 8.4 blue
15: 225 215 283 498 505 8.5 7.2 blue
16: 134 195 210 405 409 8.4 7.5 blue
17: 223 100 195 295 300 8.4 6.8 blue
18: 230 119 123 242 252 8.3 4.5 blue
19: 239 233 186 419 427 8.3 6.6 blue
20: 255 117 137 254 258 8.3 6.9 blue
21: 269 27 17 44 45 8.3 6.2 blue
22: 208 245 292 537 543 8.2 7.2 blue
23: 215 201 272 473 481 8.0 6.4 blue
24: 251 190 230 420 410 7.9 10.1 blue
25: 174 168 126 294 304 7.8 4.7 blue-red
26: 245 5 7 12 14 7.7 -7.7 blue
27: 254 177 158 335 330 7.7 9.1 blue
28: 159 83 38 121 126 7.6 3.8 red
29: 258 208 253 461 469 7.6 6.0 blue
30: 222 240 331 571 577 7.5 6.5 blue
31: 227 177 227 404 410 7.3 6.0 blue
32: 261 145 201 346 338 7.2 9.4 blue
33: 228 145 209 354 351 7.1 7.9 blue
34: 138 143 323 466 448 7.0 10.6 blue
35: 214 151 227 378 386 6.9 4.9 blue
36: 207 114 150 264 267 6.4 5.3 blue
37: 246 107 200 307 299 6.1 8.6 blue
38: 257 126 126 252 251 5.3 5.6 blue
39: 210 263 341 604 599 4.6 5.4 blue
PrecinctID EricRichey JamesErb Prosecutor County Falloff_Prosecutor Falloff_County P
Appendices
Statistical Concepts
'Falloff' refers to how much of the ballot was voted upon. 'Turnout' usually refers to how many of the active registered population voted. See here. But 'falloff' tells us: "Of those who voted, how many voted on a specific candidate or initiative" . For this post "Votes Good" are those ballots judged as ready for tabulation by the auditor. This does not imply any votes tabulated or cast from those ballots marked 'Good '. See blank ballot. In a WA state matchback, a ballot ready for tabulation is ready to be counted if it is marked as AVReturnStatus == "Good". A 'falloff percentage" is Votes for a Candidate / "Votes Good". That percentage can be assigned to each precinct for any particular candidate or initiative.A 'Correlation Coefficient' is a measure of the strength of the relationship between two sets of data. The 'Pearson correlation coefficient' is defined as the covariance of X,Y over the product of the standard deviations of X,Y. The base R language correlation coefficient function is 'cor'. 'Cor' returns a data point between 1 : -1. For practical usage:
1 = absolute correlation
0 = no correlation
-1 = absolute negative correlations
There are no universally agreed upon definitions for the strength of correlations, only generally accepted guidelines. Correlation coefficient functions produces a statistical measure that shows the mathematical strength of a numerical relationship. An oft repeated warning is "Correlation does not imply Causation". All that being said, covariance and correlation are some the best measures of relationships between linear data. The Pearson correlation coefficient normalizes covariance with standard deviation .
Data Sources
Spreadsheet fields:
as.matrix(names(c_prec))
[,1]
[1,] "PrecinctID"
[2,] "P" # Precinct blue / red prediction See below
[3,] "EricRichey"
[4,] "JamesErb"
[5,] "Robinson"
[6,] "Buchanan"
[7,] "CarolFrazey"
[8,] "AaronThomas"
[9,] "EricBostrom"
[10,] "MikePeetoom"
[11,] "VotesGood" # Votes tabulated from 08/14/2018 matchback
[12,] "Registered" # Active from 08/14/2018 matchback
[13,] "Falloff_Prosecutor" # 1 - ((Richey + Erb) / VotesGood ) * 100
[14,] "Falloff_County" # 1 - ((CarolFrazey + AaronThomas + EricBostrom + MikePeetoom ) / VotesGood) * 100
[15,] "diffP" # For diff and div see below
[16,] "divP"
[17,] "diffC"
[18,] "divC"
[19,] "diffC17"
[20,] "divC17"
# P:
BR=round(Buchanan/(Buchanan + Robinson),3) * 100
[BR >=55,P:="blue"]
[BR <=45,P:="red"]
[BR < 55 & BR >= 50,P:="blue-red"]
[BR > 45 & BR <= 50,P:="red-blue"]
# diffs and divs block
diffP=JamesErb - EricRichey
divP=round(JamesErb/(EricRichey+JamesErb),3) * 100
diffC= (CarolFrazey + AaronThomas) - (EricBostrom + MikePeetoom)
divC=round((CarolFrazey + AaronThomas) / ((EricBostrom + MikePeetoom) + (CarolFrazey + AaronThomas)),3) * 100
diffC17=Buchanan - Robinson
divC17=round(Buchanan/(Robinson+Buchanan),3) * 100)
No comments:
Post a Comment