 |
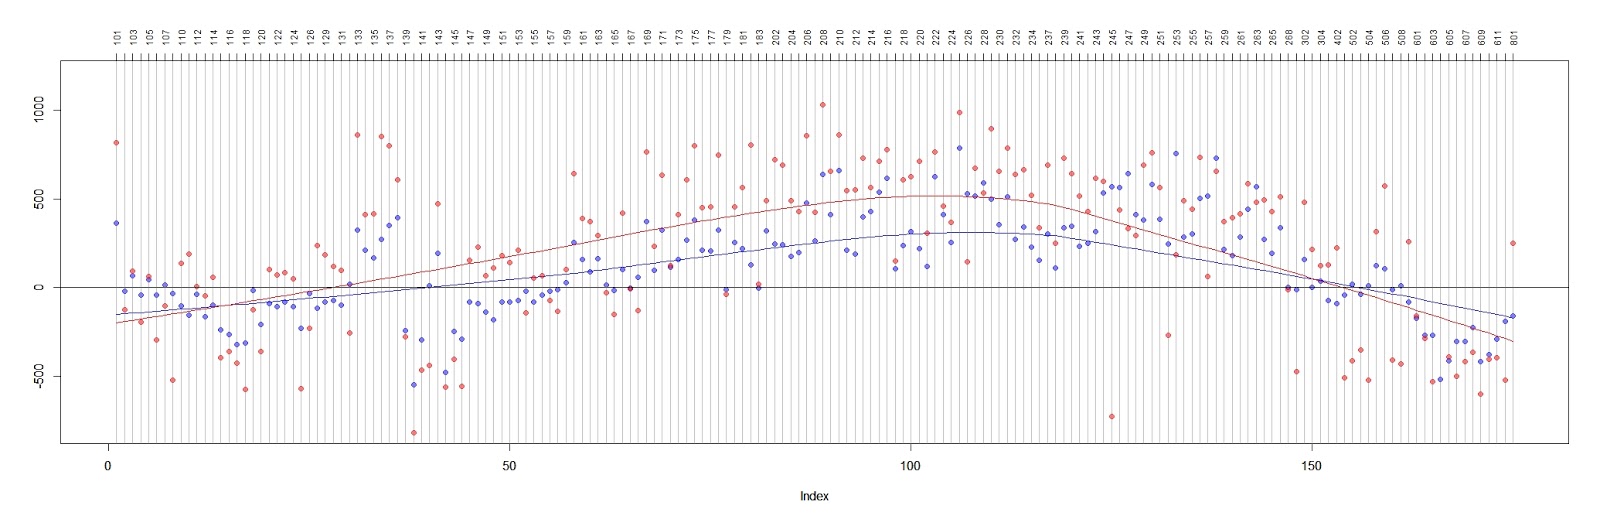
| Blue: GE 2018 Senate Results (Cantwell - Hutchison) Red: Latent class predictors (Democrats - Republicans) from 04/30/2019 voterdb. Trend lines are lowess smoothing for Whatcom County precincts across the top axis. Click to enlarge all of the charts in this post. |
I am updating the publishing date of this post from 06/20/2019 to 10/05/2019 to incorporate posts subsequent on latent class prediction. -RMF
In this post I show the use of a polytomous latent class regression library [1] to predict Democrat vs. Republican outcomes per individual voter and precincts for the Whatcom County general and primary 2019 elections. My essential latent class model is:
(PrecinctID, Age, Gender) ~ Democrat+Republican
where the 'manifests' are location (e.g. 'PrecinctID'), age, gender regressed against a 'training set equivalent' of 'covariates' derived from the AVBallotParty field of the May 24, 2016 Presidential Primary. I split the data into separate party biased precinct groups derived from the GE 2018 Senate results:
- SD = Strong Democrat
- LD = Light Democrat
- Ind = Independents are pushed to LD or LR after latent class modeling
- LR = Light Republican
- SR = Strong Republican
Then I rejoin the whole county after latent class modeling for posterior analysis. I compare these results to Whatcom County results for the GE2018 senate race for sanity. Quantitized 'manifest' variables when fed into a latent class engine produce a prediction (e.g. DemPred, RepubPred) from covariates and other unique voter data:

Given precincts grouped as regions based on a recent all county vote (e.g. Senate GE 2018) , 'sample splitting' provides more for 'parsimonious' latent class regression and a generic check on model accuracy:

LCA electoral data is informative enough to be useful as a model, but may fall well short in accuracy when compared to more specific, high dimensional data. For an example of such high dimension electoral data, please see this expository journalism piece. [2]. It should be noted that such high dimensional data is costly to purchase for many local candidates using targeted social media advertising. Additionally, a latent class approach guarantees predictors for each voter for every voterdb update. Party preference for previously unknown voters is simply another expression of the current covariates regressed against the current manifests. As of the date of this post, the WA VRDB system is still under maintenance and upgrade at the state level. Whatcom County elections will have an updated voterdb available in July. Here I use data from a 4/30/2019 voter database.
A 'zoomable', labeled map of Whatcom County precincts and precinct parts can be seen in a shared Google map created from county electoral GIS data . The map below is from a Google Earth GIS export from the same data with Precincts, Precinct Parts and County Districts. Please find the corresponding kml file suitable for import into Google Earth Pro here. Click to enlarge this chart:

Whatcom County's (2019) 179 precincts number in range from 101 - 801 with 100 series representing the north and south of Bellingham unincorporated county and the 200 - 800 series representing Bellingham proper and the other small cities respectively. The precincts can be grouped as 'precinct decades' as in the next chart. A 'precinct decade' covers a max of 10 precincts (e.g. '10' == precincts 100 - 109 inclusive) with some 'precinct decades' more populated than others. (See the shared Google map. ) The next table gives Cantwell (Democrat) and Hutchison (Republican) net votes per 'precinct decade' and currently registered voters ('All_Registered') as of 04/30/2019. Precincts 269 and 271 are missing below because their totals were small enough to be hidden in the Senate GE 2018 elections. Click to enlarge the table:

The next chart helps give a better idea of which 'RegCity' ("registration city") the voters of these precincts live in. Because the 'Reg City' field is 'self selected', some voters chose the closest urban area or the one they identify with their voting residence with the most. Some patterns can be seen. For example, unincorporated series (100 series) near an urban area often choose the closest urban area for their 'Reg City' field. Click to enlarge the table:

The chart below gives us predictor diffs (red) vs. GE 2018 Senate diffs (blue) along a population proportional precinct distribution. Above 0 is a net Democrat vote, the converse in true for Republican. Note that the predictors would seem to show a greater advantage for increased turnout for both parties, but especially for the Democrats. Note the significance of the 200 series (Bellingham) for Democrats and the very mixed results in the 100 series ('unincorporated' county). Click to enlarge chart:

This chart below gives the same data as above but evenly distributed among precincts labels. Note the wide and broad advantage the Democrats appear to have for all county races like this. Traditionally, Republican electoral strength in Whatcom County lies in receiving concentrated turnout among select precincts, most notably north county and the small cities. Looking at the 'shoulders' of Democrat strength are a significant number of 'purple' precincts for which increased participation could change results. My predictors indicate that both Democrat and Republican precincts could indeed expand their vote totals. Click to enlarge chart:
The next two charts give some idea of the scale of the difference between 2018 Primary and General Election turnout. Even with both these elections making use of the new "stampless ballot", general election turnout always swamps primary turnout.

LastVoted (top 10) ~ Predictors

Age (top 20) ~ Predictors


Links:
[1] https://www.jstatsoft.org/article/view/v042i10/v42i10.pdf :Linzer and Lewis: "poLCA: An R Package for Polytomous Variable Latent Class Analysis"
[2] https://www.upguard.com/breaches/the-rnc-files
O'Sullivan: "The RNC Files: Inside the Largest US Voter Data Leak"
poLCA citation:
Linzer, Drew A. and Jeffrey Lewis. 2013. "poLCA: Polytomous Variable Latent Class Analysis." R package version 1.4. http://dlinzer.github.com/poLCA.
Linzer, Drew A. and Jeffrey Lewis. 2011. "poLCA: an R Package for Polytomous Variable Latent Class Analysis." Journal of Statistical Software. 42(10): 1-29. http://www.jstatsoft.org/v42/i10
No comments:
Post a Comment