The easiest conclusion is that 2012 Cantwell and Obama voters did not turn out for the Democrats in 2014. It might be possible to conclude that the Republicans energized their base to vote more for their legislative candidates in 2014 than they did for their county candidates in 2013. Click on the charts below to enlarge. R Code is
here.
 |
| Clearly, the 2012 General Election (grey-blue) brought a standard of engagement in the 42 LD that neither 2013 (brown) nor 2014 (dark red) could meet. Cantwell won the 42nd handily and Obama barely in 2012; despite the fact that both Democrat candidates for state representative (Krogh and McClendon) were clobbered by 5K votes. If we assume (point blank) that the ~16K difference between the top end of the 2014 turnout (dark red) and the 2012 (grey-blue) could have represented a 3:1 edge for the Democrats, that would have been enough to make the 42nd 2014 state elections come into play. The span between the red and the blue-gray on this map may well have defined a high turnout swing vote the Democrats didn't receive in 2014. |
 |
| In the graph above, the participation difference between 2012 General Election and 2014 General Election is even more marked. This charts represents only 42 LD voters who voted in one of the 2012 (brown), 2014 (magenta), 2013 (dark gray) general elections. We can hardly say that the 2014 (magenta) election did not create engagement among what might be described as voters with no stable voting pattern in the last three elections. But we must admit that the engagement of this type of voter in either 2013, or 2014 met with little success compared to 2012. So: Was not President Obama's data driven genius of 2012 shared with local Democrats in 2014 or was this all about the Obama's 2012 appeal in the 42nd to voters who normally don't vote? |
 |
The chart above is those who voted only in the 2012 General Election (not 2013 or 2014) but were still registered to vote in 2014. In other words, 12,303 LD 42nd registered voters that could have voted in 2014 but didn't. Also, the remaining voters in LD 40 (17,655 - 12,303) that did not vote in 2014 either.
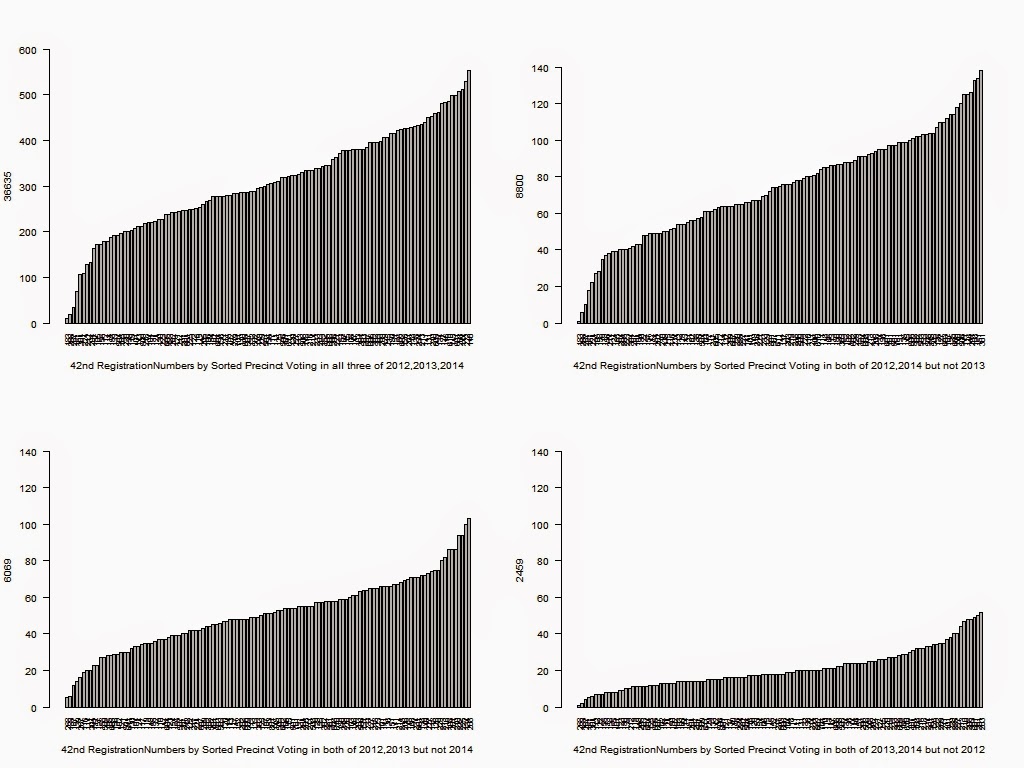
Below are charts that show participation for any of the combinations of 2012,2013,2014 general elections for both the 42nd and the entire County. 36,635 42nd LD voters participated in all three elections; markedly less for the other combinations. The smallest amount of stable voter groups belong to the people that have participated in the last two general elections for both the entire county (3,253) and the 42nd LD (2,459). That stable core of ~36K is probably not uniformly a conservative vote. But it seems clear from election results that those stable voters have a consistent effect in the 42nd LD. Click on these charts to enlarge. |

No comments:
Post a Comment