 |
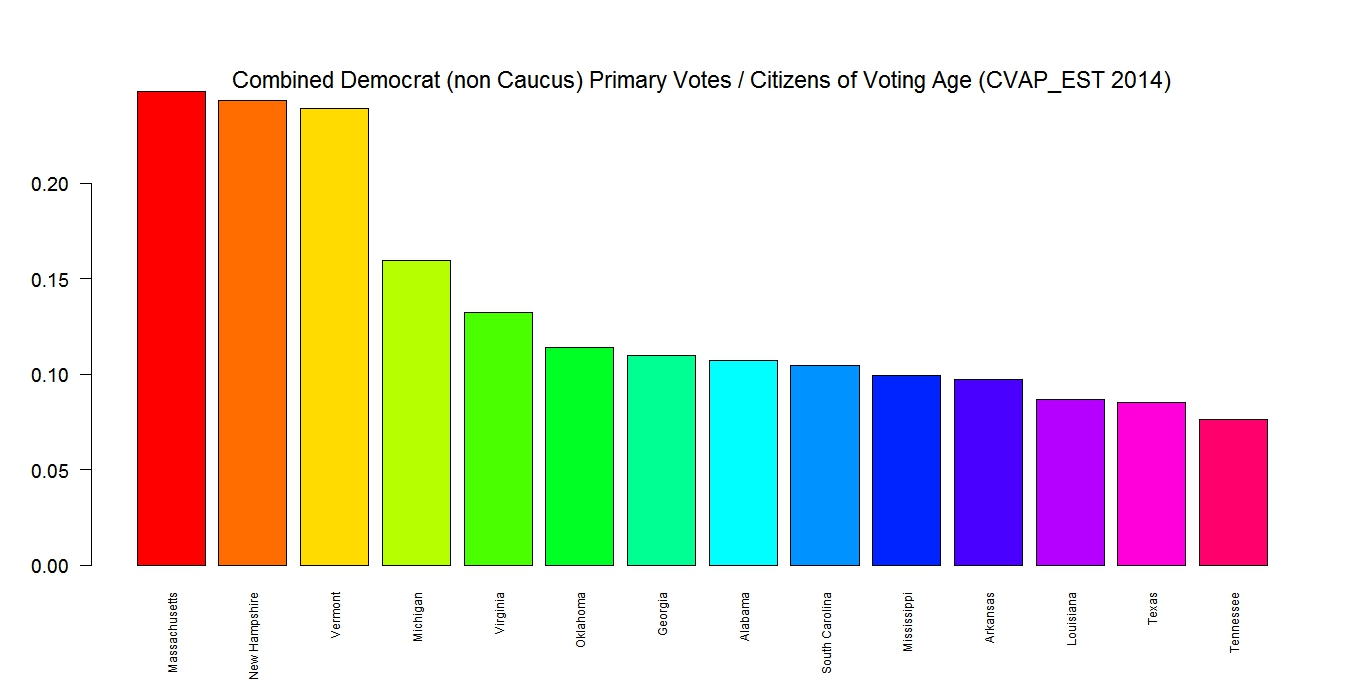
| Click to Enlarge: Sum of all Democrat votes divided into CVAP_EST 2014 |
Code for this post. [1,2]
We have to ask ourselves at some point: What are the mechanisms for the suppression of the black vote in the South and how do we define it? Is it any different than in regions outside the South? The Democrats lost 910 legislative seats nationwide between 2009 - 2014. This happened here in WA as well. But it *really* happened in the South where literally dozens of legislative seats flipped from Democrat to Republican.
All the various effects that suppress the vote of people of color: mass incarceration, voter id laws, district gerrymandering, voting machine (DRE) lack of replacements, bitter increasing poverty rates - these can be attributed to losing the legislative houses in South especially. If the black vote is suppressed nation wide and in the South today, *Democrats were in power when this happened*. You really can't blame activists like Michelle Alexander for talking about how badly mass incarceration destroys the black electorate. Essentially, convicted felons lose their right to vote (mostly forever) in the United States. It's not just the amount of people we convict; but almost everyone who serves their time for a felony that loses the vote. This isn't the case in every country. I think the effects of mass incarceration on voting would have to include all those young men who were shot or got lost in narcotics trafficking and simply stopped seeing the value of political activism. Some thoughtful recent articles on vote suppression:
- https://sojo.net/articles/4-ways-political-forces-steal-elections-and-how-we-can-stop-it
- http://www.usatoday.com/story/opinion/editorials/2014/10/20/vote-suppression-voter-id-photo-id-laws-voting-editorials-debates/17636731/
- http://newamericamedia.org/2016/03/why-arent-we-discussing-voter-suppression-in-election-year.php
- http://www.aflcio.org/Blog/Political-Action-Legislation/CWA-Wants-Your-Stories-About-Voter-Suppression
Super Tuesday Primary Totals: Democrats/Republicans. See previous post:
State Dem/Rep
[1,] "Alabama" "47%"
[2,] "Arkansas" "54%"
[3,] "Georgia" "59%"
[4,] "Massachusetts" "191%"
[5,] "Oklahoma" "73%"
[6,] "Tennessee" "43%"
[7,] "Texas" "51%"
[8,] "Vermont" "221%"
[9,] "Virginia" "76%"
Sum of Democrat Primaries/2014 CVAP_EST as of 3/11/2016 from AP Sources from Google.
State Primary DemSum/CVAP
[1,] "Massachusetts" "24.8%"
[2,] "New Hampshire" "24.4%"
[3,] "Vermont" "23.9%"
[4,] "Michigan" "16.0%"
[5,] "Virginia" "13.3%"
[6,] "Oklahoma" "11.4%"
[7,] "Georgia" "11.0%"
[8,] "Alabama" "10.7%"
[9,] "South Carolina" "10.5%"
[10,] "Mississippi" "9.9%"
[11,] "Arkansas" "9.7%"
[12,] "Louisiana" "8.7%"
[13,] "Texas" "8.5%"
[14,] "Tennessee" "7.6%"
CVAP Data: https://www.census.gov/rdo/pdf/CVAP_CSV_Format_2010-2014.zip
Primary and Caucus results as of 3/11/2016 from AP Sources:
"All Caucuses and Primaries together:"
T_Delegates B_Del B_Votes H_Del H_Votes
1315 547 3299430 758 4931842
"Just Primaries:"
T_Delegates B_Del B_Votes H_Del H_Votes
1010 373 3055004 629 4773836
"Just Caucuses:"
T_Delegates B_Del B_Votes H_Del H_Votes
305 174 244426 129 158006
| State | Type | T_Delegates | B_Del | B_Votes | H_Del | H_Votes |
| Iowa | C | 44 | 21 | 697 | 23 | 701 |
| New Hampshire | P | 24 | 15 | 151,584 | 9 | 95,252 |
| Nevada | C | 35 | 15 | 5,678 | 20 | 6,316 |
| South Carolina | P | 53 | 14 | 95,977 | 39 | 271,514 |
| Alabama | P | 53 | 9 | 76,399 | 44 | 309,928 |
| Arkansas | P | 32 | 10 | 64,868 | 22 | 144,580 |
| Colorado | C | 66 | 38 | 72,115 | 28 | 49,314 |
| Georgia | P | 102 | 28 | 214,332 | 72 | 543,008 |
| Massachusetts | P | 91 | 45 | 586,716 | 46 | 603,784 |
| Minnesota | C | 77 | 46 | 118,135 | 31 | 73,510 |
| Oklahoma | P | 38 | 21 | 174,054 | 17 | 139,338 |
| Tennessee | P | 67 | 23 | 120,333 | 44 | 245,304 |
| Texas | P | 222 | 74 | 475,561 | 147 | 935,080 |
| Vermont | P | 16 | 16 | 115,863 | 0 | 1,833 |
| Virginia | P | 95 | 33 | 275,507 | 62 | 503,358 |
| Kansas | C | 33 | 24 | 26,450 | 9 | 12,593 |
| Louisiana | P | 51 | 14 | 72,240 | 37 | 221,615 |
| Nebraska | C | 25 | 15 | 19,120 | 10 | 14,340 |
| Maine | C | 25 | 15 | 2,231 | 8 | 1,232 |
| Michigan | P | 130 | 67 | 595,222 | 60 | 576,795 |
| Mississippi | P | 36 | 4 | 36,348 | 30 | 182,447 |
To 20 Lost Legislative Seats (Politifacts article here and their spreadsheet here. )
| State | Dem2009 | Dem2014 | Lost | Region |
| New Hampshire | 238 | 170 | 68 | NE |
| West Virginia | 107 | 52 | 55 | S |
| Arkansas | 98 | 47 | 51 | S |
| Alabama | 81 | 41 | 40 | S |
| North Carolina | 98 | 62 | 36 | S |
| Minnesota | 133 | 101 | 32 | MW |
| Missouri | 85 | 54 | 31 | MW |
| Tennessee | 63 | 32 | 31 | S |
| Connecticut | 138 | 108 | 30 | NE |
| Indiana | 69 | 40 | 29 | MW |
| Michigan | 84 | 58 | 26 | MW |
| Mississippi | 101 | 76 | 25 | S |
| Oklahoma | 62 | 37 | 25 | S |
| Texas | 86 | 63 | 23 | S |
| Kansas | 57 | 35 | 22 | MW |
| Maine | 116 | 94 | 22 | NE |
| Ohio | 65 | 44 | 21 | MW |
| Washington | 95 | 74 | 21 | NW |
No comments:
Post a Comment