

Filing week starts May 14th. 2018 is a Congressional and Legislative District election year. The maps of WA state above give counties in blue outline, LDs in solid color and CDs in black outline. The more densely populated the district the smaller the size of the district. The maps above are created data from WA OFM. Click to enlarge charts in a separate window. Let me know if you have any questions or find any errors. No warranty for this data is expressed or implied. Use at your own risk.
Turnout Data
Election years vary in turnout in relationship to the interest and campaign spending in local, regional, state wide, and federal offices. Presidential years like 2016 draw the most votes. Legislative and Congressional years combined (2014, 2016, 2018) can draw significantly more votes than local election years (2013, 2015, 2017). Voter interest determines turnout in non Presidential years. This and all following data (unless noted otherwise) is from the WA SOS. Click to Enlarge:

Age Bins and Replacement Curves
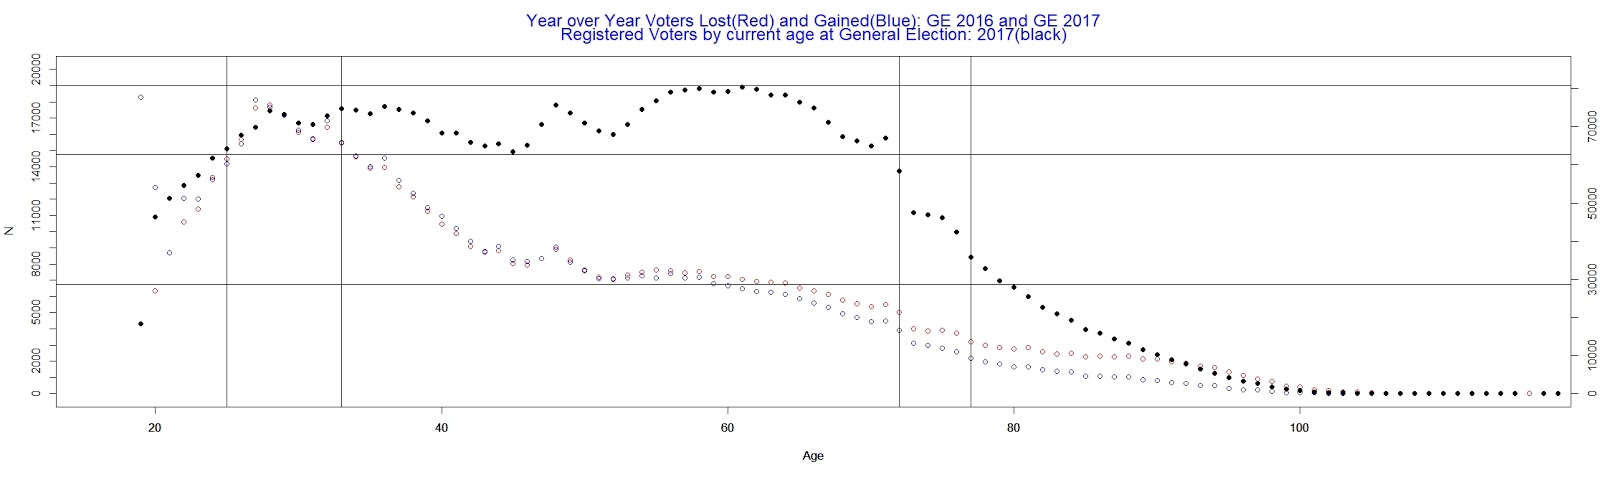
The two curves below group three separate groups of voters by their current age bins:- All registered voters in the 2017 General Election (black)
- Voters who were registered for the 2016 General Election but not for the 2017 General Election (red)
- Voters who were registered for the 2017 General Election but not for the 2016 General Election (blue):
- Click to enlarge:

We can look at the red and blue curves as "replacement curves". On the left in the first graph are those who left in the last election year and on the right are those who replaced them. The second graph shows how tight those two "replacement curves" mirror each other. Every year, 500K thousand voters are replaced by others of similar age in WA. We could say there is a "flux" of 1M each year in WA voter database which usually totals about 4.2M. The "replacement curves" have their highest age bin peaks for youth. Click to enlarge:


We can create separate vertical scales on one plot to contrast registration age bins with "replacement" age bins. Separating age bins by discrete boxes helps us understand the voter database as a collection of age groups. (Ages 25,33,72,77 below)The top age bins from from age 33 to 72 comprise 70% of the voters in WA state. These are GenX and Boomer generations that show considerably lower "replacement" curves than do the corresponding "replacement" curves for those younger than 33 and those older than 77. Perhaps we can assume as factors high mobility for youth and high morbidity for older generations. In any event, many GenX and Boomer generation provide for the most numerous age bins with the corresponding lowest replacement bins:
Voter Persistence
We can group individuals in each county by how many votes they produce for the 2017 and 2018 election years to date. The top five counties ( "KING" "PIERCE" "SNOHOMISH" "SPOKANCE" "CLARK") hold 67% of all registered voters in WA and produced 66% of all votes in 2017 and 2018 election years to date. All of the rest of the counties in WA, have voter registration totals less than 150K (second chart). Click to enlarge:


Citizen Voting Age Population by Race and Ethnicity
Below is Citizen Voting Age Population data current through 2015. The top row shows Citizen (CIT_EST) and Citizen Voting Age Population (CVAP_EST) data. The left chart most includes all Census categories for race and ethnicity. The right chart shows the same data with King County removed. The bottom row gives us difference and percentage from the same data. This data is available from the Census current to 2016 for State, County, Tract and Block Groups.
No comments:
Post a Comment