 |
| Special Election 2020 Results for Whatcom County can be found here. |
All data is from 02/12/2020 matchback and returns. More votes will be counted until certification. Check your ballot status at voteWA.gov to make sure your ballot was tabulated.
All Ballot Types By Decade:
Decade N
1: 1 532
2: 2 3764
3: 3 5956
4: 4 7262
5: 5 8662
6: 6 12860 # 60s
7: 7 11206 # 70s
8: 8 3956
9: 9 790
10: 10 15
Click on charts to enlarge:
 |
| For all ballot statuses received as of 02/12/2020 |
 |
| For all ballot statuses received as of 02/12/2020 |
From a 2017 property database, I will *guesstimate* Ferndale school district aggregate appraised values at over $4B today. This would include cities of Ferndale, Custer, Lummi Island. Ferndale school district includes part of Cherry Point refineries.
# 2017 Property Database. Values in Millions of dollars:
Prop[,.(propM=round(fsum(as.numeric(appraised_val_total))/(10^6),1)),keyby="situs_city"][1:19][order(-propM)]
situs_city propM
1: BELLINGHAM 16360.6
2: BLAINE 3546.8
3: FERNDALE 3191.2
4: LYNDEN 2364.3
5: EVERSON 706.9
6: POINT ROBERTS 586.7
7: DEMING 363.6
8: SEDRO WOOLLEY 328.6
9: CUSTER 308.3
10: SUMAS 297.4
11: LUMMI ISLAND 261.6
12: MAPLE FALLS 172.9
13: GLACIER 163.8
14: NOOKSACK 102.1
15: ACME 53.7
16: ELIZA ISLAND 22.9
17: MOUNT BAKER 15.3
18: 5.3
19: Bellingham 0.6
...
The Special February 2020 Ferndale Yes/No Levy votes correlates positively with No976/Yes976 from GE2019. Precincts 134 and 135 are partial for the Ferndale School Districts. 'Registered' and 'Accepted' columns reflect the splits. All vote counts reflect the entire Precinct (e.g the split precinct totals are duplicated):

This Google Earth screen snip shows the 134 and 135 Precinct splits between Ferndale School District (blue) and Bellingham School District (brown). Click to enlarge:

# Correlations
When the split precincts (134, 135) are removed, No on School Levy/Yes on 976 (GE 2019) and Yes on School Levy/No on 976 (GE 2019) have strong (positive) correlation coefficients:
f5[!duplicated(Precinct),cor(No,Yes976)]
[1] 0.8181656
f5[!duplicated(Precinct),cor(Yes,No976)]
[1] 0.5400791
f5[!duplicated(Precinct) & !Precinct %in% c(134,135),][,cor(No,Yes976)]
[1] 0.9007967
f5[!duplicated(Precinct) &!Precinct %in% c(134,135),][,cor(Yes,No976)]
[1] 0.7524982
# Sums
f5[!duplicated(Precinct),.(NoLevy=fsum(No),Yes976=fsum(Yes976))]
NoLevy Yes976
1: 4568 7328
f5[!duplicated(Precinct),.(YesLevy=fsum(Yes),No976=fsum(No976))]
YesLevy No976
1: 3491 5777
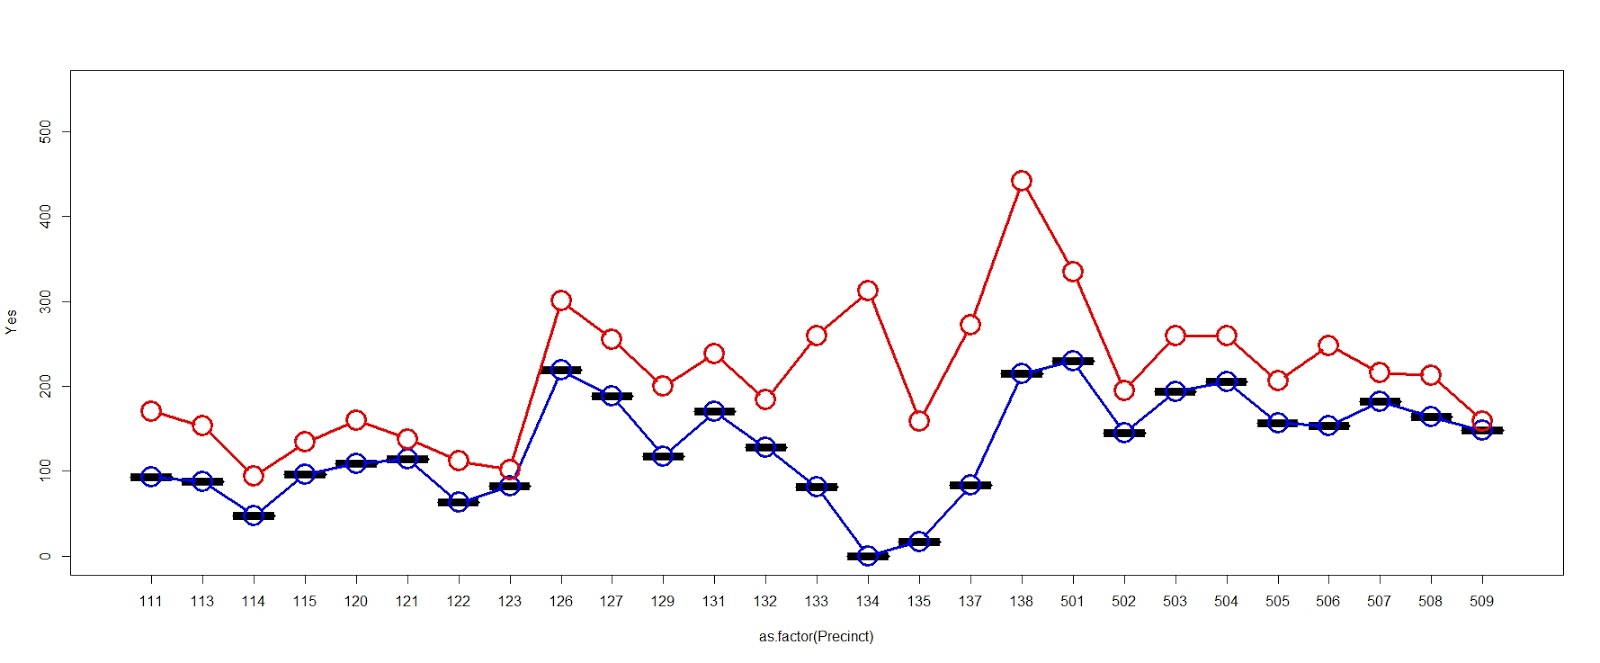
Click on Charts to enlarge. Precicnts 134 and 135 are partial (e.g. split) for the Ferndale School District:
Blue: Yes on School Levy (SE 2020) and Red: No on 972 (GE 2019):
Blue: No on School Levy (SE 2020) and Red: Yes on 972 (GE 2019):

 |
| Updated: Ferndale School District Precinct results (minus 'split' precincts 134, 135, 201) from 02/14/2020 data. The violet red is "No" on SE 2020 school levy. The light blue is "Yes" on SE 2020 school levy. i976 (blue,red) votes are from GE 2019. Click to enlarge. |
No comments:
Post a Comment