Not quite the end yet...
Here is a rough summary of the election week to come:
(1) Contrary to public belief, all of the ballots are not in. The Cascadia Weekly is reporting that there are over 4000 "Spoiled Ballots" some of which may to be discarded from the count. (Please see comment from Cascadia below.)
(2) Some party members are urging their faithful to check the their ballot status at:
http://www.co.whatcom.wa.us/auditor/elections/ballot_status/index.jsp.
There you will get a prompt that should give you a disposition of your ballot. If you inadvertently "spoiled your ballot" or it got "lost or spoiled in the mail", there may be a path that could help you re-make that ballot. The election desk at the Whatcom County Courthouse can help you with that. Make sure to check this week.
(3) It is likely that Linville and Buys will have some type of recount either by hand or machine after 11/23/2010. I've looked at the recount laws and my eyes have glossed over....
(4) The August 18th voter database I have shows 114,313 registered voters. Looks like Whatcom County picked up 2,263 new registrants in those two and one half months for a new total of 116,576
(5) Whatcom County has the highest turnout among the the top ten counties for ballots counted in WA State, although Vote By Mail turnouts are high in all WA counties. But clearly, having a 74.42% turnout gave us weight in this election beyond our meager 200,000 citizens. This was clearly felt in the election of both Patty Murray and Rick Larsen. Go Whatcom County!:
(6) Some precinct analysis will be forthcoming. You can get precinct results for every election from
http://wei.secstate.wa.gov/whatcom/CurrentElection/ElectionResults/Pages/ElectionResults.aspx
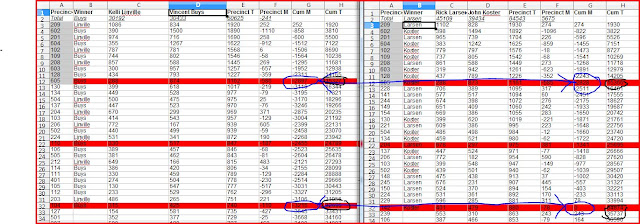
Here's an example of some I started last week that shows that the top ten precincts with the most voter turn out created an almost identical result for Larsen/Koster as for Linville/Buys. After that, things change:
Certification Date: | 11/23/2010 |
Number of Precincts: | 120 |
Number of Registered Voters: | 116576 |
Total Ballots Cast: | 86758 |
Ballots Left to Count: | 150 |
Next Ballot Count On: | Nov 17 2010 5:00PM |
Last Tabulated: | Nov 12 2010 6:13PM |
Voter Turnout: | 74.42% |
Here is a rough summary of the election week to come:
(1) Contrary to public belief, all of the ballots are not in. The Cascadia Weekly is reporting that there are over 4000 "Spoiled Ballots" some of which may to be discarded from the count. (Please see comment from Cascadia below.)
(2) Some party members are urging their faithful to check the their ballot status at:
http://www.co.whatcom.wa.us/auditor/elections/ballot_status/index.jsp.
There you will get a prompt that should give you a disposition of your ballot. If you inadvertently "spoiled your ballot" or it got "lost or spoiled in the mail", there may be a path that could help you re-make that ballot. The election desk at the Whatcom County Courthouse can help you with that. Make sure to check this week.
(3) It is likely that Linville and Buys will have some type of recount either by hand or machine after 11/23/2010. I've looked at the recount laws and my eyes have glossed over....
(4) The August 18th voter database I have shows 114,313 registered voters. Looks like Whatcom County picked up 2,263 new registrants in those two and one half months for a new total of 116,576
(5) Whatcom County has the highest turnout among the the top ten counties for ballots counted in WA State, although Vote By Mail turnouts are high in all WA counties. But clearly, having a 74.42% turnout gave us weight in this election beyond our meager 200,000 citizens. This was clearly felt in the election of both Patty Murray and Rick Larsen. Go Whatcom County!:
| County | Registered Voters | Total Ballots Counted To Date | Voter Turnout % | Last Updated Date/Time | Next Ballot Count Date/Time | Estimated Ballots On Hand To Be Processed |
| Total | 3601152 | 2473312 | 68.68% | 11/12 6:13 PM | 91878 | |
| King | 1069791 | 721223 | 67.42% | 11/12 4:20 PM | 11/15 4:30 PM | 50000 |
| Pierce | 410081 | 271689 | 66.25% | 11/12 4:54 PM | 11/15 5:00 PM | 350 |
| Snohomish | 377739 | 255888 | 67.74% | 11/12 4:20 PM | 11/15 5:00 PM | 14000 |
| Spokane | 261250 | 174081 | 66.63% | 11/12 5:37 PM | 11/16 6:00 PM | 12000 |
| Clark | 219616 | 148486 | 67.61% | 11/10 2:29 PM | 11/16 5:00 PM | 200 |
| Thurston | 149024 | 102186 | 68.57% | 11/10 4:37 PM | 11/17 6:00 PM | 4500 |
| Kitsap | 143796 | 98941 | 68.81% | 11/10 5:12 PM | 11/16 5:00 PM | 6500 |
| Whatcom | 116576 | 86758 | 74.42% | 11/12 6:13 PM | 11/17 5:00 PM | 150 |
| Benton | 88498 | 63828 | 72.12% | 11/12 10:51 AM | 11/15 4:30 PM | 250 |
| Yakima | 99568 | 62778 | 63.05% | 11/12 4:42 PM | 11/15 5:00 PM | 100 |
(6) Some precinct analysis will be forthcoming. You can get precinct results for every election from
http://wei.secstate.wa.gov/whatcom/CurrentElection/ElectionResults/Pages/ElectionResults.aspx
Here's an example of some I started last week that shows that the top ten precincts with the most voter turn out created an almost identical result for Larsen/Koster as for Linville/Buys. After that, things change:

1 comment:
I've been enjoying your analysis. BTW, when we put the estimated number of "spoiled" ballots in the Index, we didn't mean to imply these would be discarded, but that because of some reason they could not be machine counted. Probably in most cases because they were filled out using red ink or because the security envelope hadn't been signed. The number of ultimately unusable ballots will be far smaller.
Post a Comment