Post updated to reflect link to successful legal challenge based on Voting Rights Act - RMF
The vote is all but over now with a scant 120K left to be tabulated. After that tabulation is done, 1.76M out of 3.9M registered WA voters (~45%) will have voted in an important "off year" election. But if all the counties of WA had voted with the pluck of Whatcom County (54.5%), another 390K would have brought that voting total to 2.13M. The top ten counties give us 3.2M of the states total of 3.9M registered voters. So let's take a look at Whatcom County's significance. Data, sorted by registrants, is from http://vote.wa.gov/results/current/Turnout.html :
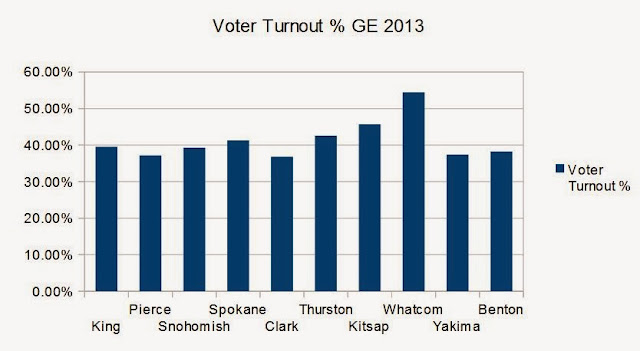
Right away we can see how Whatcom County's electorate "plays above its head" in any WA state turnout. First, the electoral disaster that is Yakima County, assures that a smaller Whatcom County not only has 21K more registered voters but this year had 20K more voter turnout as well. Second, despite having a smaller population and registered voting populace than either Kitsap or Thurston, Whatcom County's high turnout means that it returns voter totals competitive with either county. Despite the fact that Whatcom County is still a small county compared to the "big five" (King, Pierce, Snohomish, Spokane and Clark = 2.5M registered voters), when those top five voting counties turnout at scarcely 40% then Whatcom's big turnouts become more significant. Here is a graph of turnout percentage to date among the top ten counties in WA:
The revolution has started here in Whatcom County. After we quell the counter-revolutionary insurgency, we just need to export our turnouts to the rest of the state!

