# https://walkerke.github.io/tidycensus/
# https://walkerke.github.io/tidycensus/articles/basic-usage.html
# https://walkerke.github.io/tidycensus/articles/other-datasets.html
# https://api.census.gov/data/2018/pep/components/variables.html
# https://www.census.gov/programs-surveys/acs/guidance/handbooks.html
# https://www.census.gov/quickfacts/kingcountywashington
# https://www.census.gov/quickfacts/fact/table/whatcomcountywashington/PST045218
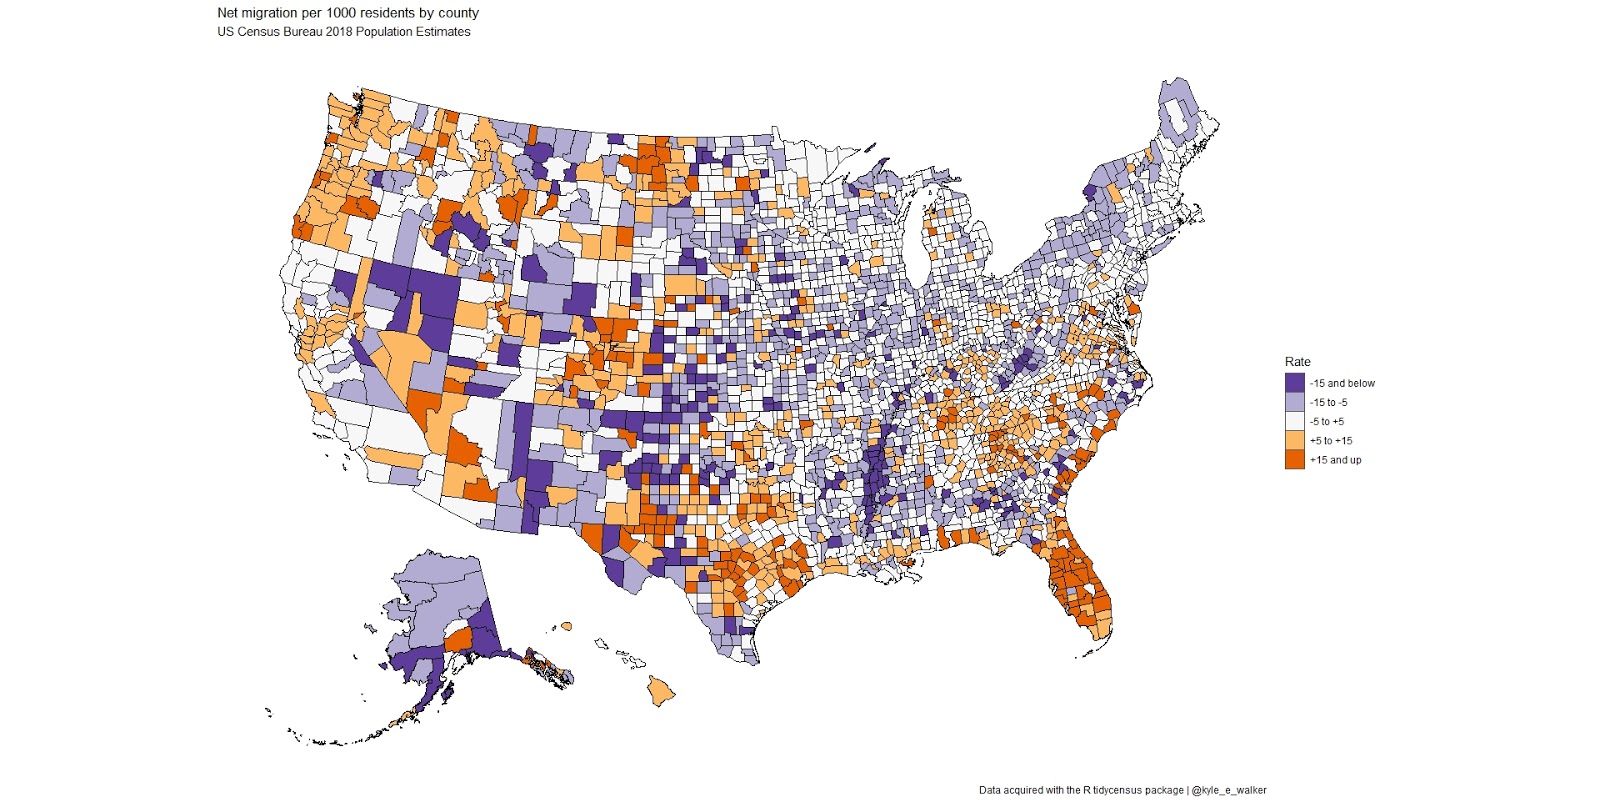
For me, the effect of this map is to show vast swaths of the midwest and northeast draining into states like Florida, Georgia,Texas, Washington, Oregon and to a lesser degree Colorado, North Dakota, Nevada and Arizona. Washington and Georgia Counties are shown as separate maps. If I had to guess, I would say much of the country is fed up with polar freezes, drought, fire and hurricanes. Apparently, they have decided to trade all of that for continual drizzle and rain in Portland and Seattle. Or maybe there are only three choices now for really smart youth seeking high incomes: San Francisco, Portland, or Seattle. Some example data and 2015:2018 growth Census derived tables for King and Whatcom Counties are far below. Click to enlarge the maps.
5/23/2019: Added Appendix 1 : Top and Bottom 50 US Counties for "net migratioon" in 2018.
US Maps
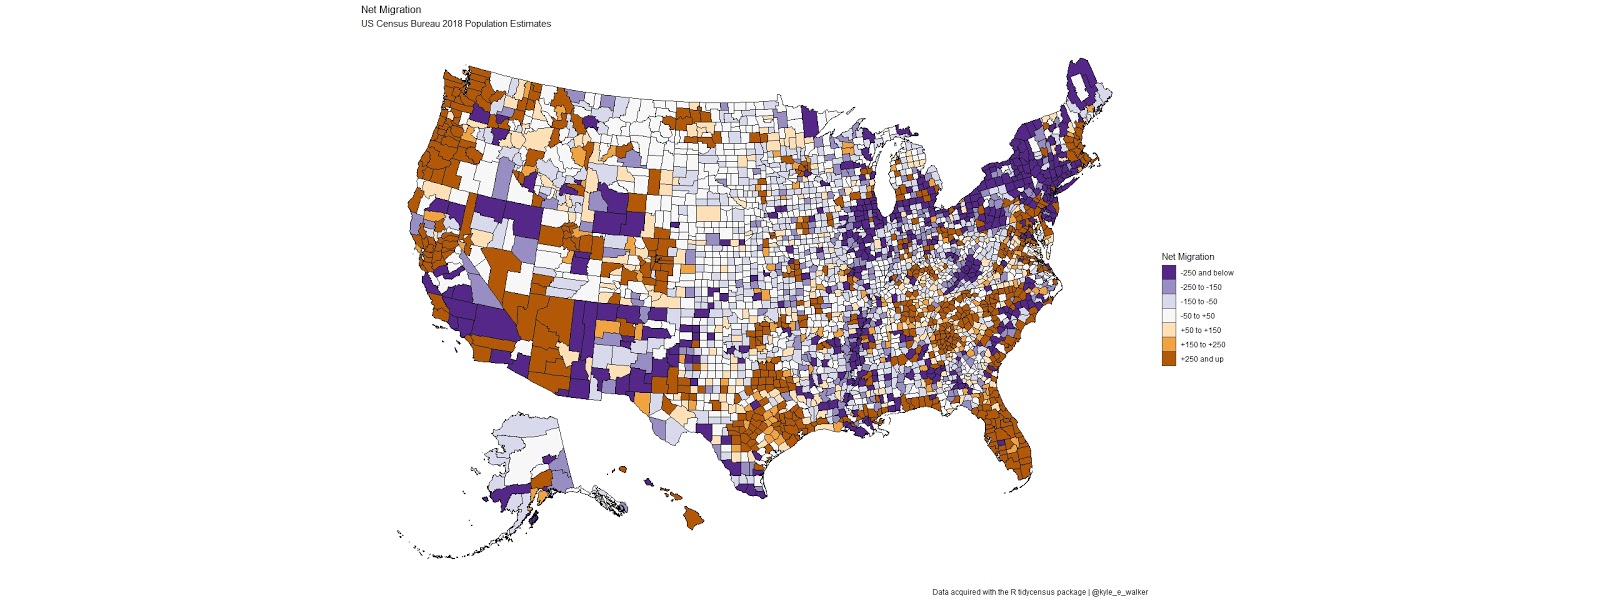
The two US maps for 2018 below are (1) rate of net migration and (2) net migration. These charts paint a similar picture except that the rate of net migration has five categories and the net migration has seven. If the "US is full", obviously certain areas are more "filled" than others. Reputedly, about 14% or 40M of the US population moves each year. Typically there are urban and/or job seeking biases to migratory flows in the US. More information from the US Census here. Click to enlarge the maps.
State Maps
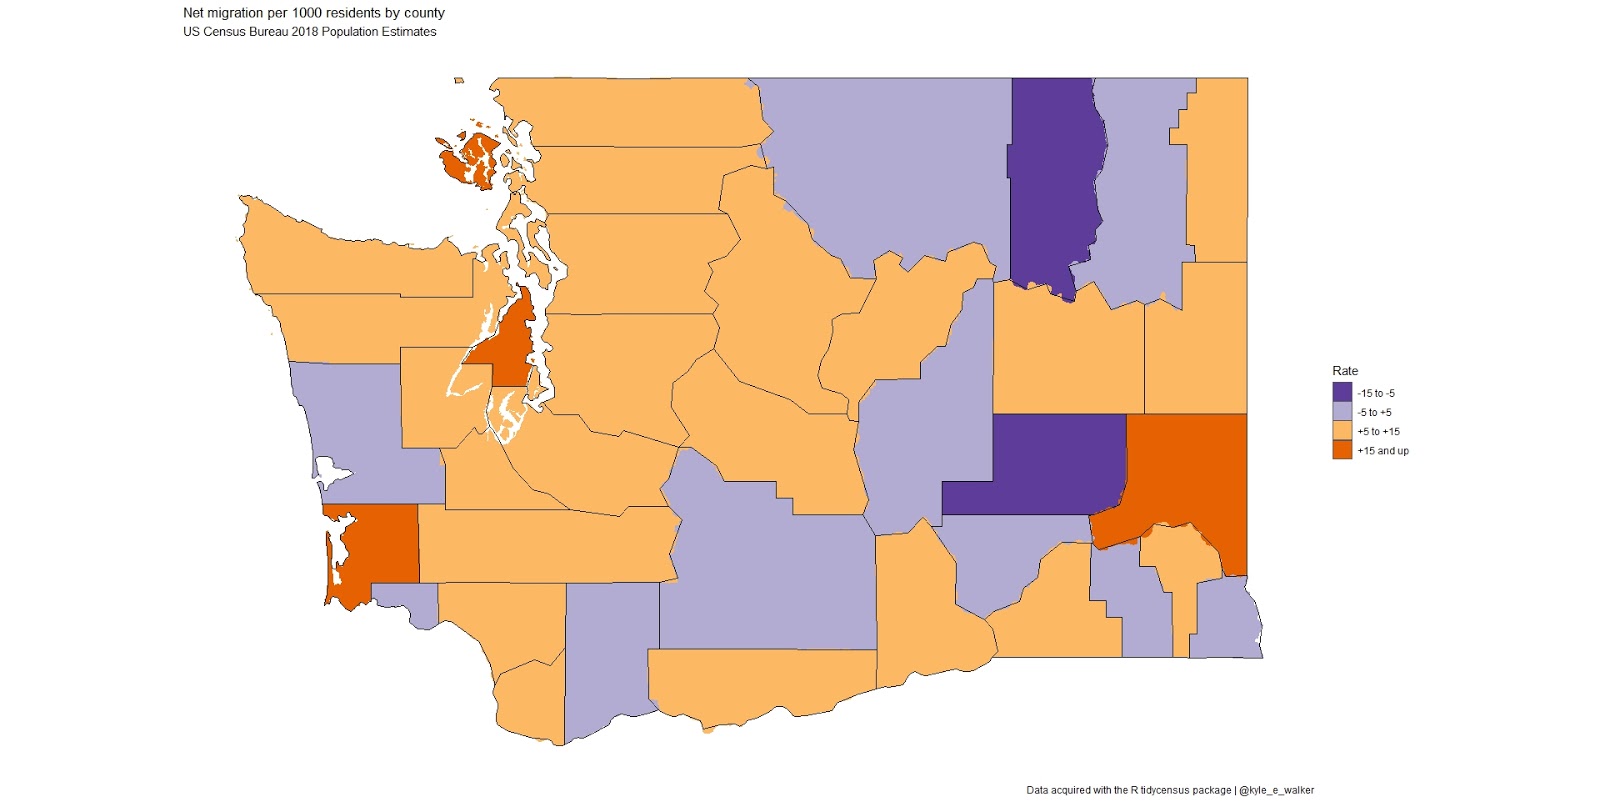 |
| WA State 2018 |
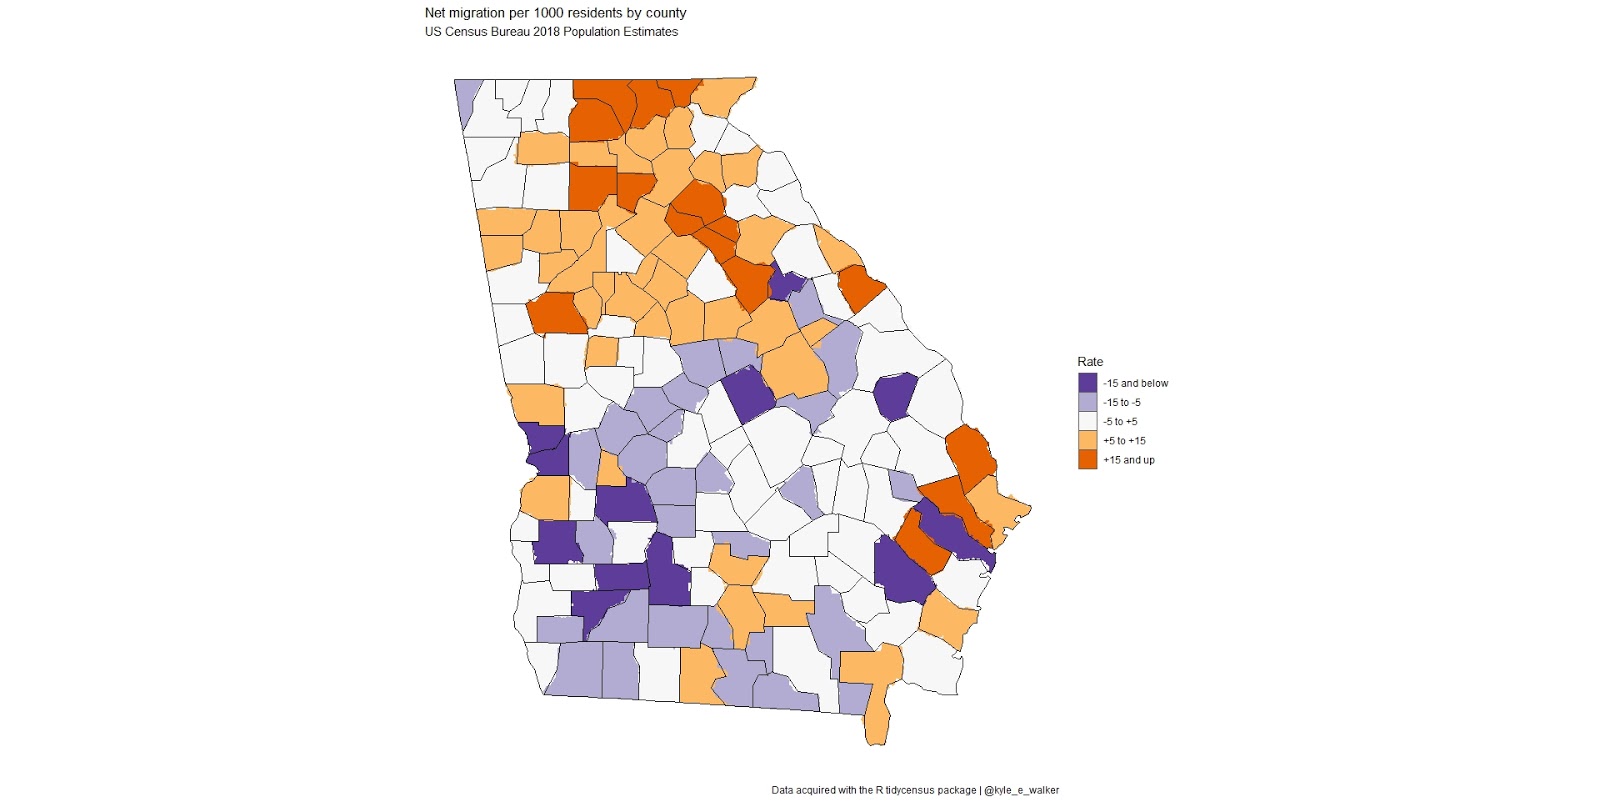 |
| Georgia State 2018 |
WA State Net Migration from Google Earth Shapefile Snapshot
 |
| WA State Net Migration Totals for Counties with over 2K in Net Migration for 2018. See table below. |
2018 WA Population Change Data for Net Migration and Net Migration Rate
Table is ranked descending by Net Migration.RNETMIG == Net Migration per 100K residents.
NAME NETMIG RNETMIG
1: King County 28385 13.4772265
2: Snohomish County 8061 10.5547358
3: Pierce County 7636 9.1414835
4: Clark County 6410 14.1616304
5: Kitsap County 4948 19.3004183
6: Spokane County 4327 8.9062701
7: Whatcom County 2898 13.7949090
8: Benton County 2472 13.1189997
9: Thurston County 2090 7.8425634
10: Skagit County 1392 11.5233696
11: Island County 1151 14.5027059
12: Cowlitz County 1148 11.2082558
13: Clallam County 1057 14.5093652
14: Whitman County 1027 21.6110433
15: Chelan County 678 9.0828103
16: Lewis County 584 7.7723138
17: Douglas County 534 13.2911865
18: Mason County 474 7.7929765
19: Pacific County 425 20.5140582
20: Kittitas County 377 8.7992624
21: Walla Walla County 368 6.1583774
22: Jefferson County 366 12.1051761
23: Grays Harbor County 279 3.9348424
24: San Juan County 248 15.3999006
25: Pend Oreille County 184 14.1516690
26: Stevens County 118 2.7122072
27: Klickitat County 111 5.3032656
28: Lincoln County 63 6.1415481
29: Okanogan County 49 1.1863832
30: Garfield County 18 8.1392720
31: Columbia County 17 4.2794210
32: Wahkiakum County 11 2.7261462
33: Skamania County -3 -0.2636783
34: Ferry County -60 -7.9422861
35: Asotin County -70 -3.1606276
36: Grant County -136 -1.4573667
37: Adams County -199 -10.3527208
38: Franklin County -264 -2.9911286
39: Yakima County -1130 -4.5646330
NAME NETMIG RNETMIG
Some Example Population Change Data for Whatcom and King Counties
King County (2.2M) has experienced an estimated 15.6% population change from April 2010 to July 2018. Whatcom County (225K) has experienced an estimated 12.2% population change from April 2010 to July 2018. The categories in the tables below are abbreviated for space:- YEAR
- DOMESTICMIG
- INTERNATIONALMIG
- NATURALINC
- NETMIG
- RDOMESTICMIG
- RINTERNATIONALMIG
- RNETMIG
Select King County migration and natural increase data for 2015 : 2018
YEAR DOMESTICMIG INTMIG NATINC NETMIG RDOMMIG RINTMIG RNETMIG2015 5965 16269 12714 22234 2.840873 7.748226 10.589099
2016 8511 15500 12325 24011 3.991815 7.269784 11.261598
2017 2802 17327 12517 20129 1.289874 7.976318 9.266192
2018 7044 21341 12414 28385 3.344498 10.132728 13.477227
King County 2018: Natural Increase (Births - Deaths) + Net Migration (Domestic + International):
- Let 'resident' refer to both natural and migratory population increase
- Let 'immigrant' refer to only domestic or international migration increase
[1] 3399.917 # new residents each month
(28385) / 12
[1] 2365.417 # new immigrants each month
(12414 + 28385) / 365
[1] 111.7781 # new residents each day
(28385) / 365
[1] 77.76712 # new immigrants each day
Select Whatcom County migration and natural increase data for 2015 : 2018
YEAR DOMESTICMIG INTMIG NATINC NETMIG RDOMMIG RINTMIG RNETMIG2015 2374 471 805 2845 11.28394 2.238726 13.52267
2016 3305 397 791 3702 15.40922 1.850971 17.26019
2017 3950 421 737 4371 18.04980 1.923789 19.97359
2018 2332 566 798 2898 11.10067 2.694244 13.79491
Whatcom County 2018: Natural Increase (Births - Deaths) + Net Migration (Domestic + International):
- Let 'resident' refer to both natural and migratory population increase.
- Let 'immigrant' refer to only domestic or international migration increase.
[1] 308 # new residents each month
(2898) / 12
[1] 241.5 # new immigrants each month
(798 + 2898) / 365
[1] 10.12603 # new residents each day
(2898) / 365
[1] 7.939726 # new immigrants each day
Appendix 1
Top and Bottom Counties for "Net Migration" in 2018 below. A list of the most populous counties in the US can be found here: https://en.wikipedia.org/wiki/List_of_the_most_populous_counties_in_the_United_States
GEOID NAME variable value groups geometry
1: 17031 Cook County NETMIG -38838 -250 and below
2: 06037 Los Angeles County NETMIG -19179 -250 and below
3: 36047 Kings County NETMIG -18357 -250 and below
4: 26163 Wayne County NETMIG -12092 -250 and below
5: 48141 El Paso County NETMIG -9565 -250 and below
6: 36081 Queens County NETMIG -8447 -250 and below
7: 36103 Suffolk County NETMIG -7547 -250 and below
8: 51059 Fairfax County NETMIG -6546 -250 and below
9: 47157 Shelby County NETMIG -6285 -250 and below
10: 39035 Cuyahoga County NETMIG -5790 -250 and below
11: 55079 Milwaukee County NETMIG -5766 -250 and below
12: 02020 Anchorage Municipality NETMIG -5355 -250 and below
13: 17043 DuPage County NETMIG -4673 -250 and below
14: 37051 Cumberland County NETMIG -4198 -250 and below
15: 18089 Lake County NETMIG -4178 -250 and below
16: 48061 Cameron County NETMIG -4045 -250 and below
17: 36055 Monroe County NETMIG -3747 -250 and below
18: 09009 New Haven County NETMIG -3720 -250 and below
19: 13179 Liberty County NETMIG -3697 -250 and below
20: 24510 Baltimore city NETMIG -3609 -250 and below
21: 34031 Passaic County NETMIG -3447 -250 and below
22: 13215 Muscogee County NETMIG -3154 -250 and below
23: 17097 Lake County NETMIG -3080 -250 and below
24: 29510 St. Louis city NETMIG -3070 -250 and below
25: 42003 Allegheny County NETMIG -3044 -250 and below
26: 36059 Nassau County NETMIG -2960 -250 and below
27: 36005 Bronx County NETMIG -2958 -250 and below
28: 34013 Essex County NETMIG -2956 -250 and below
29: 42101 Philadelphia County NETMIG -2892 -250 and below
30: 36045 Jefferson County NETMIG -2868 -250 and below
31: 21093 Hardin County NETMIG -2847 -250 and below
32: 17197 Will County NETMIG -2841 -250 and below
33: 09003 Hartford County NETMIG -2741 -250 and below
34: 18097 Marion County NETMIG -2642 -250 and below
35: 34001 Atlantic County NETMIG -2603 -250 and below
36: 09001 Fairfield County NETMIG -2515 -250 and below
37: 26049 Genesee County NETMIG -2512 -250 and below
38: 06107 Tulare County NETMIG -2405 -250 and below
39: 34017 Hudson County NETMIG -2380 -250 and below
40: 34007 Camden County NETMIG -2317 -250 and below
41: 34023 Middlesex County NETMIG -2315 -250 and below
42: 28049 Hinds County NETMIG -2248 -250 and below
43: 36061 New York County NETMIG -2230 -250 and below
44: 17201 Winnebago County NETMIG -2168 -250 and below
45: 39095 Lucas County NETMIG -2152 -250 and below
46: 22017 Caddo Parish NETMIG -2145 -250 and below
47: 22033 East Baton Rouge Parish NETMIG -2091 -250 and below
48: 17163 St. Clair County NETMIG -2088 -250 and below
49: 48485 Wichita County NETMIG -2066 -250 and below
50: 26145 Saginaw County NETMIG -2028 -250 and below
GEOID NAME variable value groups geometry
1: 48201 Harris County NETMIG 56159 +250 and up
2: 04013 Maricopa County NETMIG 52146 +250 and up
3: 32003 Clark County NETMIG 31790 +250 and up
4: 53033 King County NETMIG 28385 +250 and up
5: 12099 Palm Beach County NETMIG 25467 +250 and up
6: 12095 Orange County NETMIG 24755 +250 and up
7: 12057 Hillsborough County NETMIG 24234 +250 and up
8: 48157 Fort Bend County NETMIG 23779 +250 and up
9: 48439 Tarrant County NETMIG 23081 +250 and up
10: 48085 Collin County NETMIG 22799 +250 and up
11: 48029 Bexar County NETMIG 22111 +250 and up
12: 12071 Lee County NETMIG 21871 +250 and up
13: 48121 Denton County NETMIG 19295 +250 and up
14: 37183 Wake County NETMIG 17064 +250 and up
15: 12011 Broward County NETMIG 16752 +250 and up
16: 06001 Alameda County NETMIG 16200 +250 and up
17: 48453 Travis County NETMIG 16183 +250 and up
18: 06065 Riverside County NETMIG 15370 +250 and up
19: 48339 Montgomery County NETMIG 14951 +250 and up
20: 48491 Williamson County NETMIG 14915 +250 and up
21: 12086 Miami-Dade County NETMIG 14677 +250 and up
22: 48113 Dallas County NETMIG 14310 +250 and up
23: 12103 Pinellas County NETMIG 14120 +250 and up
24: 37119 Mecklenburg County NETMIG 14073 +250 and up
25: 08031 Denver County NETMIG 13422 +250 and up
26: 12105 Polk County NETMIG 13204 +250 and up
27: 12101 Pasco County NETMIG 12282 +250 and up
28: 12009 Brevard County NETMIG 12077 +250 and up
29: 12127 Volusia County NETMIG 11990 +250 and up
30: 12081 Manatee County NETMIG 11706 +250 and up
31: 45051 Horry County NETMIG 11165 +250 and up
32: 06085 Santa Clara County NETMIG 10880 +250 and up
33: 12115 Sarasota County NETMIG 10763 +250 and up
34: 06013 Contra Costa County NETMIG 10383 +250 and up
35: 12069 Lake County NETMIG 10376 +250 and up
36: 12097 Osceola County NETMIG 10262 +250 and up
37: 06067 Sacramento County NETMIG 10244 +250 and up
38: 13135 Gwinnett County NETMIG 9857 +250 and up
39: 39049 Franklin County NETMIG 9751 +250 and up
40: 06073 San Diego County NETMIG 9705 +250 and up
41: 06075 San Francisco County NETMIG 9224 +250 and up
42: 12031 Duval County NETMIG 8802 +250 and up
43: 12021 Collier County NETMIG 8604 +250 and up
44: 04021 Pinal County NETMIG 8341 +250 and up
45: 12109 St. Johns County NETMIG 8147 +250 and up
46: 53061 Snohomish County NETMIG 8061 +250 and up
47: 48209 Hays County NETMIG 7990 +250 and up
48: 08069 Larimer County NETMIG 7926 +250 and up
49: 11001 District of Columbia NETMIG 7907 +250 and up
50: 41051 Multnomah County NETMIG 7764 +250 and up
No comments:
Post a Comment