Summary:
Exactly 610, 451 ballots have been 'Accepted' or 'Received' in last night's (10/30/2019) statewide matchback. Another 8,323 have been rejected or 'challenged'. The WA SoS total for this is 618,984 'Ballots Received' for a turnout of 13.8%. This statewide total is ~41% of the approximately 1.5M votes received for each of the 2015 and 2017 ('off year') general elections. To see my piece on projected ballot totals for this election please see here.
The current vote is dominated by those born in the 1940s or 1950s (now ages 60 - 79). These two decades have a combined 300,010 ballots accepted. By comparison, those born 1980 or afterwards (ages 18 - 39) have a combined 26% of that (300,010) total with 79,289 ballots accepted. That "youth" or millennial vote in WA still has not yet to compete with the pre-war and boomer votes in this general election. (That percentage is unchanged in the last two matchback reports.) GenXrs, those born in the 60s and 70s are contributing 155,966 votes. But keep in mind this amazing statistic: Those born in the 1930s (55,720 voted) are currently outvoting those born in the 1980s(48,735 voted). Say what you will about the older vote: Pre-wars and boomers vote like their lives depend upon it. Please see 'Age by Status' below. To see my updated and ongoing piece on WWU precinct turnout, see here.
Men are currently out voting women in 25 of 39 counties but this is the first time in my matchback reports that summed female and male votes are nearly equal. I am reminded that I noticed a strong male registration trend in July 2018. Personally, I am thinking this is male backlash to the women's movement, but more on that this weekend. For the state as a whole:
BallotStatus Female Male
1: Accepted 299290 299815 # Ready for tabulation
2: Received 4687 4330 # In the chute
3: Rejected 3919 4319 # Challenged or Rejected
For our neck of woods (Whatcom, Skagit, San Juan), accepted female votes are ahead of male votes for the second time in these matchback reports:
BallotStatus Female Male
1: Accepted 17816 17141
2: Rejected 166 205
Tables made from rdata.table code with output follow the break. Widescreen is best for viewing:
Thursday, October 31, 2019
Wednesday, October 30, 2019
Matchback 10.29.2019: State and local counties
Summary:
Exactly 528,842 have been 'Accepted' or 'Received' in last night's (10/28/2019) statewide matchback. Another 7,516 have been rejected or 'challenged'. The WA SoS total is 536,497 'Ballots Received' for a turnout of 11.9%. This statewide total is ~36% of the approximately 1.5M votes received for each of the 2015 and 2017 ('off year') general elections. To see my piece on projected ballot totals for this election please see here.
The current vote is dominated by those born in the 1940s or 1950s (now ages 60 - 79). These two decades have a combined 262,057 ballots accepted. By comparison, those born 1980 or afterwards (ages 18 - 39) have a combined 26% of that (262,057) total with 67,675 ballots accepted. That "youth" or millennial vote in WA still has not yet to compete with the pre-war and boomer votes in this general election. GenXrs, those born in the 60s and 70s are contributing 133,125 votes. Please see 'Age by Status' below. To see my updated and ongoing piece on WWU precinct turnout, see here.
Men are currently out voting women in 29 of 39 counties and this is remarkable given the current political environment and the fact that ~170K more women are registered than men statewide. I am reminded that I noticed this trend in July 2018. For the state as a whole:
BallotStatus Female Male
1: Accepted 257443 261775 # Ready for tabulation
2: Received 3939 3669 # In the chute
3: Rejected 3500 3943 # Challenged or Rejected
For our neck of woods (Whatcom, Skagit, San Juan), female voters are ahead of male voters for first time in these matchback reports:
BallotStatus Female Male
1: Accepted 15761 15389
2: Rejected 133 178
Tables made from rdata.table code with output follow the break. Widescreen is best for viewing:
Tuesday, October 29, 2019
Projections for Total Votes for GE 2019
Voting picks up dramatically on the four days leading up to the election day and the day after. To understand how vote by mail makes the day after a large volume ballot reception day, please see here. The data here is actual (e.g. from Ballot Statistics) up until October 28th. 1.4M to 1.6M votes is my current best estimates, but a lot of turnout depends on final voting week. Those estimates would be consistent with the last local general election: GE 2017 which had 1,582,481 votes or 37.1% of the 4,265,433 registered voters. There are no separate Ballot Statistics calculated for most weekends. I substitute 11/7 data for the certified total in the data table below the break. Click to enlarge chart.

Monday, October 28, 2019
Matchback 10.28.2019: State and local counties
Summary:
Exactly 438,734 have been 'Accepted' or 'Received' in last night's (10/28/2019) statewide matchback. Another 6,475 have been rejected or 'challenged'. The WA SoS total is 445,336
'Ballots Received' for a turnout of 9.9%. This statewide total is ~30% of the approximately 1.5M votes received for each of the 2015 and 2017 ('off year') general elections.
The current vote is dominated by those born in the 1940s or 1950s (now ages 60 - 79). These two decades have a combined 215,673 ballots accepted. By comparison, those born 1980 or afterwards (ages 18 - 39) have a combined 24% of that (215,673) total with 52,459 ballots accepted. That "youth" or millennial vote in WA still has not yet to compete with the pre-war and boomer votes in this general election.
Men are currently out voting women in all but eight counties and this is remarkable given the current political environment and the fact that ~170K more women are registered than men statewide. I am reminded that I noticed this trend in July 2018. For the state as a whole:
BallotStatus Female Male
1: Accepted 205148 213680 # Ready for tabulation
2: Received 9292 8914 # In the chute
3: Rejected 3006 3401 # Challenged or Rejected
For our neck of woods (Whatcom, Skagit, San Juan), female and male voters are essentially even the first time in these matchbacks:
BallotStatus Female Male
1: Accepted 12853 12793
2: Rejected 110 134
Tables made from rdata.table code with output follow the break. Widescreen is best for viewing:
Saturday, October 26, 2019
Updated: WWU precinct turnout as 11/06/2019
 |
| Some 14 possible 'WWU' precincts colored red <-> blue by GE 2018 votes for Senator Maria Cantwell. See similar colored all county map with WWU circle inset at bottom of this post. Click to Enlarge the Map. |
Below the break find tables of turnout for 14 nearby WWU precincts. (Yes, we all know you students can live all over town.) This data is up to date as of Wednesday's matchback (11/06/2019). I starred the dorm precincts 245 and 252. Youth voting picked up greatly in election week. Note: Use of October 1st VRDB for Registration numbers and SDR ("Same Day Registration") assure plus 100% for some voting Decades:
Decade Age Registered Voted Turnout
1: 1910s 100s 3 2 66.7
2: 1920s 90s 70 77 110.0
3: 1930s 80s 324 422 130.2
4: 1940s 70s 987 1146 116.1
5: 1950s 60s 1407 1396 99.2
6: 1960s 50s 1158 936 80.8
7: 1970s 40s 1231 790 64.2
8: 1980s 30s 1761 968 55.0
9: 1990s 20s 4289 1350 31.5
10: 2000s 10s 386 146 37.8
PrecinctCode Active Inactive Accepted Received Rejected
1: 224 440 116 239 NA 4
2: 225 1254 298 623 5 10
3: 227 978 101 522 7 10
4: 228 957 140 509 7 10
5: 231 1232 215 513 14 3
6: 245 544 1146 120 1 2 *
7: 246 880 178 403 5 8
8: 248 958 157 402 5 7
9: 250 1022 47 721 3 4
10: 252 231 443 65 1 4 *
11: 253 1276 473 459 25 6
12: 255 759 62 381 9 1
13: 256 882 66 556 3 4
14: 257 747 198 317 3 8
3254
"Over 50 years of Age:"
3979
 |
| Click to enlarge All County (Whatcom) colored red <-> blue by votes for Senator Maria Cantwell in GE 2018. |
Friday, October 25, 2019
Matchback 10.25.2019: State and local counties
Summary:
Exactly 334,813 have been 'Accepted' or 'Received' in last night's (10/25/2019) statewide matchback. Another 5,025 have been rejected or 'challenged'. The WA SoS counts this as 339,918 'Ballots Received' for a turnout of 7.6%. However, this total is ~27% of the approximately 1.5M votes received for each of the 2015 and 2017 ('off year') general elections.
The current vote is dominated by those born in the 1940s or 1950s (now ages 60 - 79). These two decades have a combined 165,274 ballots accepted. By comparison, those born 1980 or afterwards (ages 18 - 39) have a combined 24% of that (165,274) total with 39,413 ballots accepted. The "youth" or millennial vote in WA has yet to compete with the boomer votes.
Men are currently out voting women in all but two counties and this is remarkable given the current political environment and the fact that ~170K more women are registered than men statewide. I am reminded that I noticed this trend in July 2018. For the state as a whole:
BallotStatus Female Male
1: Accepted 154087 164601 # Ready for Tabulation
2: Received 7442 7446 # In the chute
3: Rejected 2342 2628 # Challenged or Rejected
For our neck of woods: Whatcom, Skagit, San Juan:
BallotStatus Female Male
1: Accepted 9518 9788
2: Rejected 82 107
Tables made from rdata.table code with output follow the break. Widescreen is best for viewing:
Matchback 10.24.2019: State and local counties
Summary:
Exactly 275,000 have been 'Accepted' or 'Received' in last night's (10/24/2019) statewide matchback. Another 4,707 have been rejected or 'challenged'. The WA SoS counts this as 279,694 'Ballots Received' for a turnout of 6.2%. However, this total is ~18% of the approximately 1.5M votes received for each of the 2015 and 2017 ('off year') general elections.
The current vote is dominated by those born in the 1940s or 1950s (now ages 60 - 79). These two decades have a combined 134,462 ballots accepted. By comparison, those born 1980 or afterwards (ages 18 - 39) have a combined 24% of that (134,462) total with 31,721 ballots accepted. The "youth" or millennial vote in WA has yet to emerge with strength or volume.
Men are currently out voting women in almost every county and this is remarkable given the current political environment and the fact that ~170K more women are registered than men statewide. I am reminded that I noticed this trend in July 2018. For the state as a whole:
BallotStatus Female Male
1: Accepted 123592 134681 # ready for tabulation
2: Received 7870 7834 # in the chute
3: Rejected 2176 2479 # challenged
For our neck of woods: Whatcom, Skagit, San Juan:
BallotStatus Female Male
1: Accepted 7007 7416
2: Rejected 57 73
Tables made from rdata.table code with output follow the break. Widescreen is best for viewing:
Wednesday, October 23, 2019
Matchback 10.23.2019: State and local counties round up
These are some quick and dirty counts and groupings from state and local county matchbacks for 10.23.2019. Both statewide and locally, the vote so far is strongly male and dominated by those born between 1930 and 1970. With only 4.6% of the vote in and another 13 days of voting to go, this could change. There is a high percentage of challenged and undeliverable ballots statewide, so make sure to check www.votewa.gov to make sure your ballot was accepted and that your registration address was correct. If not, contact your local county election department. For more information, please see: https://www.sos.wa.gov/elections. Get your ballots in ASAP!
Monday, October 21, 2019
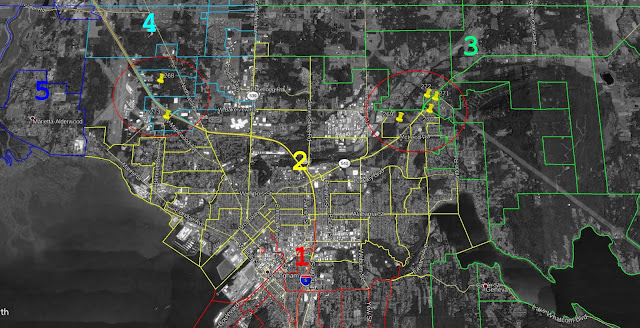
Six recent UGA Precincts: Deserving of more attention?
Before I start the matchback report sequence for GE 2019, I thought I would take a look at some sparse UGA regions recently turned Bellingham precincts. Inside the red circles are six recent (previous UGA now Bellingham) precincts. They are not well populated. Unlike the other higher numbered Bellingham precinct series (250s, 260s), they are not located in south Bellingham. Instead they are located in northwest (268, 273) and northeast (269, 270, 271, 272) Bellingham and are somewhat atypically split between County Council, Legislative and Congressional districts . With the possible exception of Precinct 270 (Gundie's Auto Recycling), these districts will probably see increasing voter growth. Please see more data and analysis below the break. Click to enlarge the Google Earth Pro screenshot below.

Thursday, October 17, 2019
GE 2019: Precincts Video and County Districts 4 & 5 Projections
GE 2019: The Precincts and County Districts. About 2 minutes.
County Council Districts 4 and 5 will be a struggle for the Democrats. There is a reasonable if contested chance of Democratic victory for District 5. District 4 will require an especially dedicated Democratic turnout to steal victory from the solid Republican precincts. If a federal election volume of turnout is achieved for the Democrats, the contested 'All County' offices (Executive, Sheriff, County at Large (B) and Assessor) should go blue. But local elections (usually odd years) seldom match federal elections (usually even years) in turnout. This is especially true for Bellingham's large and left leaning student vote.
Because of this dynamic, David Ramirez(R) could beat Carol Frazey(D) in the County Council at Large (B) race, although Mr. Ramirez is challenging an incumbent. Similarly, Daniel Miller(R) may fare significantly better than some would expect against Liz Lovelett(D) in the Whatcom's 40th LD because student and youth voting will be less energized. The other contested races (Executive, Sheriff, Assessor) are legitimate tossups in a local election year. Additionally, the format and order of races/issues in this ballot are "vote suppressive" by default. Placed first on the ballot by law will be:
- 1 Referendum
- 1 Initiative
- 12 Advisories (Count'em!)
- 1 Proposed Constitutional Amendment
The more casual voter will have to wade through all of that before the candidate races themselves meet his or her eyeballs. The responsible voter upon reading this would think such detail would be irrelevant to voter participation. They would be wrong. I would fain advise that the 'casual' voter should systematically study all the issues before voting but that may not be helpful either. Thus this advice: It is OK to skip the thick parts so you vote for actual people if the end result of the potential frustration in voting for the thick parts means you simply don't turn in a ballot at all! The non-binding advisory proponents can blame me for their irrelevant losses. There, I said it. Having said that, the folks that want you to vote No on Tim Eyman's 976 are freaking out as they read my italicized advice...
- For an online Whatcom clickable precinct/district map see here.
- Whatcom Elections has a map/shape file repository, however the shape files are not recent enough.
- For more general Whatcom County election links see my post here.
- District 4 and 5 in depth tables follows after the break
Wednesday, October 9, 2019
Predicting 2019 Outcomes: Part II
Here is a summary and snapshot of my latest latent class predictions. Use at your own risk. -RMF
Saturday, October 5, 2019
Predicting 2019 outcomes: Part I
 |
| Blue: GE 2018 Senate Results (Cantwell - Hutchison) Red: Latent class predictors (Democrats - Republicans) from 04/30/2019 voterdb. Trend lines are lowess smoothing for Whatcom County precincts across the top axis. Click to enlarge all of the charts in this post. |