Updated on 10/10/2018. Still under construction.
Voter Histories for Primary 2018 are due first week in September and will allow for Primary 2018 to be incorporated into this post. The tables below want a wide screen. Gender is a such a widespread and binary classifier that understanding it's significance in terms of blue/red, young/old, white/POC appears difficult. That women register and vote more than men is an easy insight. Who women vote for in what counties and why they vote is more difficult.
To give a simple example relevant to the 2018 midterms: It is possible that the new stampless ballot could increase conservative votes among women of low motility and busy schedules in red counties. There is some evidence that partisanship of gender is more clearly defined when gender is considered as a function of location, age, religion, race, class, income, party allegiance and education levels. Peering into a wide scale 'binary classifier' like gender and gender's relationship to other electoral co-variants is proving to be more that a weekend's task. The tables below want a wide screen.
Tuesday, August 28, 2018
Sunday, August 26, 2018
Projecting CD, LD, LCD results for 2018 from 2016 Presidential Results
My first inference is that GE 2018 midterms in WA will be highly reflective of GE 2016 Presidential votes in party preference and volume. My predictions: Increased volumes of female voters and increased volumes of "stampless voters" will make the GE 2018 midterms in WA record breaking in volume. If you want the spreadsheets for this data, email me: Tell me who you are and why you need that data. Click to enlarge charts. -RMF 11:16 AM 8/26/2018.
Wednesday, August 22, 2018
Tables and Charts from the Final Primary 2018 Whatcom County matchback
Below are some tables and charts from the final Whatcom County matchback. Will need wide screen to display correctly.
Monday, August 20, 2018
42nd Primary Data
This post will need a wide screen and is probably not viewable on some phones. I am using Whatcom County results from 08/15/2018 but will update with certified vote totals after 08/20/2018.
Saturday, August 18, 2018
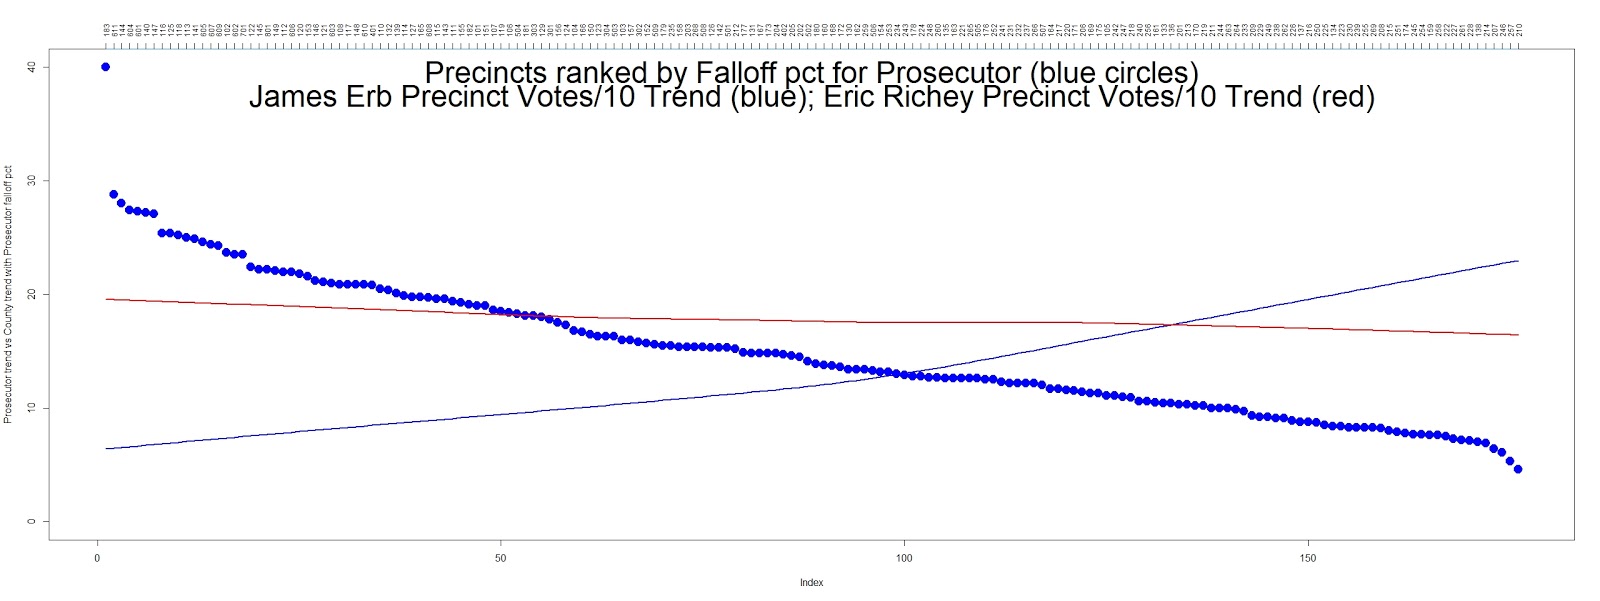
Richey vs. Erb in the Whatcom 2018 Primary
 |
| James Erb ~8K loss to Eric Richey in the primary was distributed by falloff percentage across many precincts. In the chart above,there were ~4K less votes in the Prosecutors race vs. the County at Large Race. In the chart below, the ('lowess') trend line representing James Erb precinct votes increases dramatically as precinct falloff in the Prosecutor's race decreases. Votes are scaled by dividing by 10 to match the 'falloff percentage". Click to enlarge the graphs. |
Tuesday, August 14, 2018
The effect of the "stampless ballot" in WA State
The current WA State turnout percentage for Primary 2018 will be one of the highest for the 19 Primary elections since year 2000. The 1.7M votes will be the largest number of votes ever returned for a primary election in WA State. My initial inference is that the new stampless ballots are bringing an entire new voter pool into play. WA as a state is beset by both by rural poverty and independent voters. The nearest comparable Legislative District election year is a Presidential year (2016):
(Primary2018) - (Primary 2016)
1710872 - 1421841
[1] 289031
(Primary2018) / (Primary 2016)
1710872/1421841
[1] 1.203279
A twenty percent increase in votes for General Election 2018 because of stampless ballots means an entirely new voter profile for WA State.
Thursday, August 9, 2018
Sunday, August 5, 2018
Primary 2018 Matchback Sequences
Update 7:01 PM 8/21/2018
The WC Primary election has been certified. 62,707 "Good Votes" were tabulated, making this the largest primary in the history of Whatcom County. By comparison, GE 2017 had 63,606 "Good Votes" so this primary is comparable in participation to last year's general election. It is suspected by some of us that the "stampless ballot" and a polarized, vitrolic political climate contributed much to this turnout. I suspect we can look for an 85K - 90K turnout for what will be a heavily contested GE 2018 on November 6th. The midterm is currently 77 days from today Tuesday, August 21, 2018. 2,786 ballots were returned "undeliverable". If you didn't receive a ballot this election, you probably forgot to change your address when moved. It is probable you will shortly be made an inactive voter. To remedy this, please use myvote.wa.gov to update your address or call you local election office.
AVReturnStatus N
1: Good 62707
2: Not Voted 73719
3: Challenged 702
4: Void 655
5: Undeliverable 2786 # If you didn't get your ballot: myvote.wa.gov
Unresolved Challenges included:
2: Too Late 438
3: No Signature Match 180
4: No Signature 32
Primary 2018 Returns
Ballot Return Statistics
This is probably the last Ballot Status Report. Two were filed for 8/6 and 8/7. I used the PM filing for both days. Although the turnout volume will grow until certification, those numbers will be reflected in election results due tonight August 7, 2018 at 8PM. August 7, 2018 primary results can be found here: http://results.vote.wa.gov/results/20180807/Turnout.html. As a note, my projections are simply based upon applying the 2016 CT_pct below to each county. Actual results might vary widely from such projections. -RMF 6:56 PM 8/7/2018
Saturday, August 4, 2018
Age and the Primary Turnout
Analysis and data updated from August 10th matchback - RMF 6:52 AM 8/12/2018
There were any number of important reasons to vote in the August 7th Primary, and vote many did. This table is from August 9th Whatcom County matchbacks merged with July's VRDB:
AgeRange Active VotesGood PctGood_AgeRange
1: 17 - 54 80113 24115 30.1
2: 55 - 80 53542 33779 63.1
3: 81 - 106 6721 4483 66.7