Below are 'Violin Plots' (e.g. 'mirrored density plots') [1, 2] of voter participation by birth year for WA in the top 5 and second top 5 counties. These plots have at a least a visual similarity to 'population pyramids' seen here and here. But these are density plots.[3, 4] These charts portray the density of the population proportions of each; not the explicit volumes against each other. See list of all counties at far bottom of this post.
The top row in the two charts below are an age profile for those who have a voting record from 2012 or after (e.g. 'LastVoted'). The bottom rows are those voters without any voting history. The purple horizontal lines are ages for 30, 45, 60, 75, 90. I notice the 'pinch' at age 45 (birth year 1974) in the top row and the heavy 'shoulders' for age 60 (birth year 1959) plus some. In the bottom row, the 'hats of no previous voting participation' begin a strong drop off at age 45 (birth year 1974) which becomes stronger at age 30 (birth year 1989). Whatcom County appears to have the largest band of 30 and under (birth year 1989 and less) participation bulge. King County appears to have the smallest band of 60 (birth year 1959) plus participation. Click on the charts to enlarge.


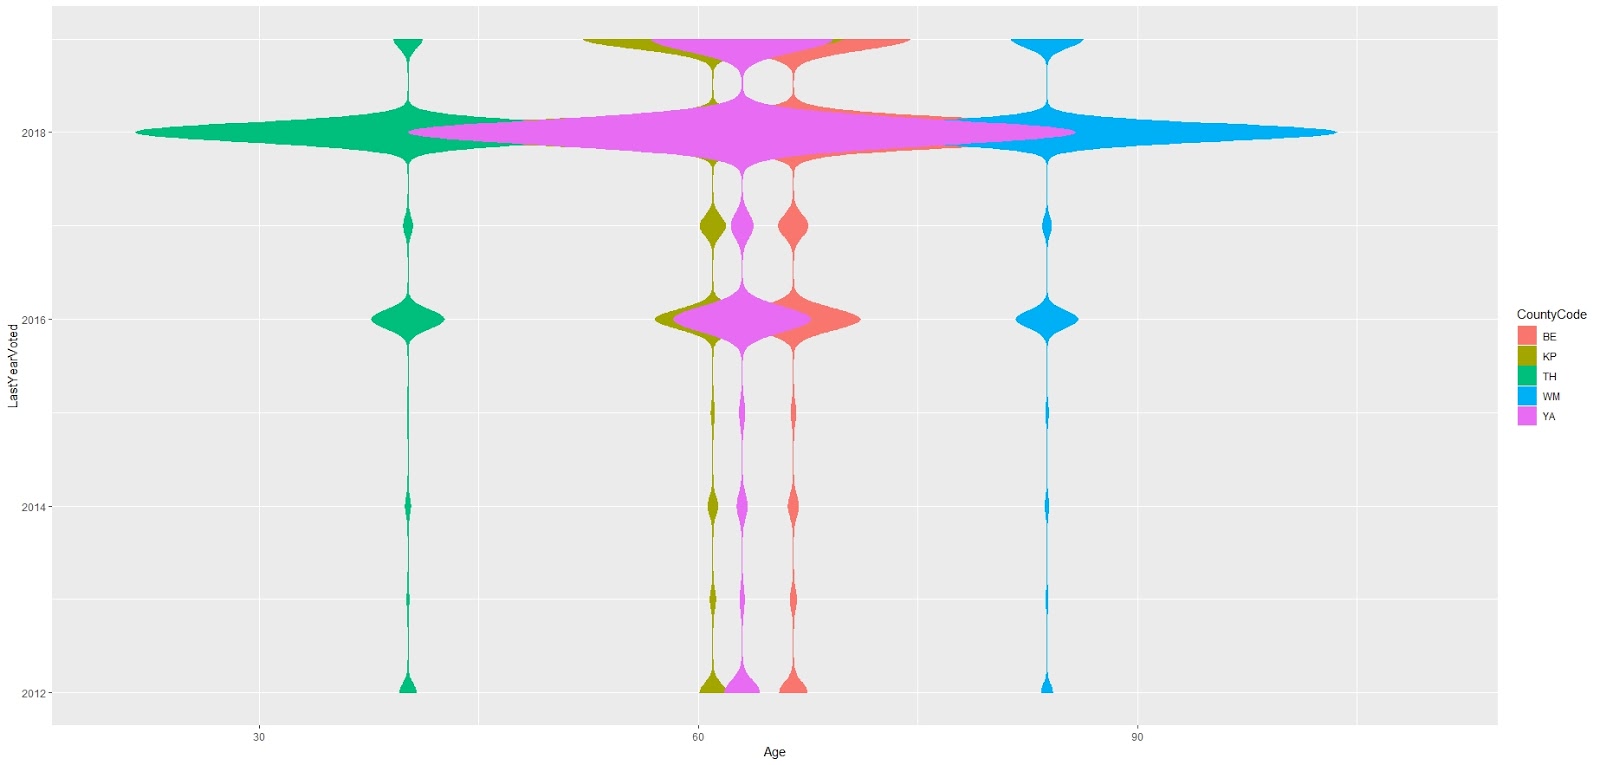
Another use of violin plots is to examine LastYearVoted ~ Age. The top five counties are above the bottom five below. Clearly the voting populations of WA turned out for GE 2018. Click on the charts to enlarge.

April 2019 VoterDB: Active Only
CountyCode Voted.2012orAfter NoRecordVoted Neither1: AD 5502 1085 238
2: AS 11890 2452 365
3: BE 94566 15656 1753
4: CH 39128 5639 701
5: CM 46733 5490 1031
6: CR 239377 41463 5164
7: CU 2526 194 20
8: CZ 54713 9408 1554
9: DG 18116 3575 405
10: FE 4100 507 79
11: FR 28422 7238 704
12: GA 1529 105 20
13: GR 34179 6384 727
14: GY 35470 6896 1093
15: IS 49098 6643 752
16: JE 23427 1873 321
17: KI 1130646 146866 24036
18: KP 145794 21575 3399
19: KS 22393 3544 257
20: KT 12641 1631 223
21: LE 40966 6502 1026
22: LI 6447 759 91
23: MA 33670 5654 640
24: OK 19984 2934 448
25: PA 12900 1822 250
26: PE 7991 1092 122
27: PI 425109 72948 12119
28: SJ 12573 910 128
29: SK 66254 8740 1402
30: SM 6787 930 128
31: SN 402529 55328 10090
32: SP 273317 42058 5964
33: ST 27216 3261 696
34: TH 152370 26963 3780
35: WK 2815 306 30
36: WL 30309 4261 642
37: WM 128052 14852 2236
38: WT 20595 4408 143
39: YA 93463 19902 3868
CountyCode Voted.2012orAfter NoRecordVoted Neither
No comments:
Post a Comment