Translate

Sunday, June 17, 2018

Colllapsible Trees

These are images of Collapsible Trees of LCDs, RJIs, by LCD, Precincts and Counties. Click to Enlarge.
See http://rmfmedia.com/public/viewhtml for URLs.
See also https://cran.r-project.org/web/packages/collapsibleTree/collapsibleTree.pdf
The 'hierarchy' argument defines the tree data in the code below the break.

No warranty for any data is expressed or implied. 
Please use at your own risk. Please understand all the laws that govern the use of WA Electoral Data: https://www.sos.wa.gov/elections/vrdb/vrdbfaq.aspx

Wednesday, June 6, 2018

The Libertarian Challenge in WA State

Top 6 Party Prefers declared during filing week by Count (N):

                            PartyName   N
 1:        (Prefers Democratic Party) 168
 2:        (Prefers Republican Party) 144
 3:                                    36
 4:       (Prefers Independent Party)  19
 5:      (States No Party Preference)  14
 6:       (Prefers Libertarian Party)  12
...
See table at bottom for full list.

I dug into the campaign contributions and expenditures this last weekend and found myself captivated the "strength" of the Libertarian movement nationwide and in WA State. Matthew Dubin has multiple $2K donations from out of state 'libertarian supporters'. As of last Friday, he is nearly leading the campaign funding race in LD 36th outspending his opponent incumbent Noel Frame.

Sunday, June 3, 2018

PDC Contributions through June 1st

This is PDC data for 2018 campaign contributions until June 1 or the first five months of this year. We now are five months from the November general elections. I list the top 20 for each query ordered by Contrib (Contribution).

Saturday, June 2, 2018

PDC Expenditures through June 1st

This is PDC data for 2018 campaign expenditures until June 1 or the first five months of this year. We now are five months from the November general elections. I list the top 20 for each query ordered by expenditure (Expend).

Thursday, May 24, 2018

2018 Filing week is over... (Part III)


Click to Enlarge WA Map of LD, CD, Precincts.
WA State filing week is over. The state lists 416 Legislative, Congressional, Judicial and Federal candidates for office.  Each county also has local offices.You can find more information at these URLs:
https://weiapplets.sos.wa.gov/elections/Candidates/WhoFiled? 

Download:
https://weiapplets.sos.wa.gov/Elections/Candidates/ExportToExcel?electionYear=0&countyCode=XX # all state
https://weiapplets.sos.wa.gov/Elections/Candidates/ExportToExcel?electionYear=0&countyCode=WM # Whatcom 


Some lists with R Code (from data.table library) below the break. Font needs wide screen and probably some zoom.

Tuesday, May 15, 2018

Here Comes Filing Week : Part II

Filing week is upon us. You can check here:


https://weiapplets.sos.wa.gov/elections/Candidates/WhoFiled? # Entire State

https://weiapplets.sos.wa.gov/elections/Candidates/WhoFiled?countyCode=wm # Whatcom County


Below the break are tables of GE 2016 Presidential and Legislative votes by County and Legislative District.

A Postgres query  like this:

 Guy Palumbo        | Legislative District 1 - State Senator  | 28003 #KI only

 Mindie Wirth       | Legislative District 1 - State Senator  | 22395 #KI only

 Mindie Wirth       | Legislative District 1 State Senator    | 30850 # “Rest of State” not KI

 Guy Palumbo        | Legislative District 1 State Senator    | 40758 # “Rest of State” not KI

can be confusing because it shows King County ("KI") and Rest of the State ("ROS") in two separate entries.

Far below, LDs split between KI and “ROS” are expressed like this as an R (data.table) query:

  LD KI_TRUMP ROS_TRUMP KI_CLINTON ROS_CLINTON Trump Clinton

  1     5987     16836      14921       31482 22823   46403

or split between LD ~ County for KI and “ROS” like this:

   LD County KI_TRUMP ROS_TRUMP KI_CLINTON ROS_CLINTON Trump Clinton

   1     KI     5987         0      14921           0  5987   14921

   1     SN        0     16836          0       31482 16836   31482

Let me know if you have any questions or find any errors. No warranty for this data is expressed or implied. Use at your own risk.

-RMF 1:12 PM 5/14/2018

Thursday, May 3, 2018

Here Comes Filing Week 2018 (Part I)


Filing week starts May 14th. 2018 is a Congressional and Legislative District election year. The maps of WA state above give counties in blue outline, LDs in solid color and CDs in black outline.  The more densely populated the district the smaller the size of the  district.  The maps above are created data from WA OFM. Click to enlarge charts in a separate window. Let me know if you have any questions or find any errors. No warranty for this data is expressed or implied. Use at your own risk.

Wednesday, April 4, 2018

Blaine School District 503 Proposition 2018-3 Technology and Capital Projects Levy

Blaine School District 503 Proposition 2018-3 Technology and Capital Projects Levy is winning by 237 votes as of Monday 4/30/2018. The Blaine School District showed strong anti-tax sentiment in comparison to the 2016 Blaine School District levy.  This race could have gone either way. The numbers below the break are from Friday, April 27. This race will be certified May 4.

Thursday, March 29, 2018

Cross County Active Voter Migrations: GE2016 to GE2017


 42,890 active voters moved counties between 11.2016 and 12.2017.   Click to enlarge the chart above to show what the top 20 migration flows looked liked. Thanks to consultant Kyle Walker for the clear instructions on using the networkD3 library.

Wednesday, March 28, 2018

"LCD" and LD Projections: 2018


These are "LCD" projections for 2018. Each LD part is coupled with their CD match (e.g. 42_1, 42_2) to give a more realistic picture of what races are competitive and what are not based on 2016 Presidential Votes. When I look at it this way, only LDs 6,10,17,24,26,44 represent competitive races. (e.g. margins less than 5% for the LD.) Some 'LCD's are competitive but the LD race is drowned out by the strength of one party in the opposing LCD(s). Not all LDs are split between CDs. The more dense, urban LDs in Seattle are often encompassed by one CD.

Monday, March 19, 2018

WCD 2018 Election Results

In the 2018 Whatcom Conservation District election,  Alan Chapman (endorsed by both the Riveter's Collection and the Whatcom Democrats) appears to have defeated incumbent Larry Helm by 31 votes. Last year, Heather Christianson defeated Suzanne Snyder. Click on the chart to enlarge. View this data on a wide screen. Candidate statements here.

Monday, March 12, 2018

March 2018: Data For Counties, LD and CD.


For all of you who are thinking about filing for office in May: WA VRDB  and OFM GIS data by County, LD, CD with some snapshots of data are below the break. Click to enlarge the images.

Tuesday, March 6, 2018

Republicans encroaching on COB precincts?


Below are two bar plots that show Republican voters are making some gains in COB and other liberal precincts since 2016. This data looks at marginal percentage differences for 87 (February Special Election) precincts between:

  • 2016: Clinton vs. Trump
  • 2017: Buchanan vs. Robinson
  • 2018: BPS501_Approved vs. BPS501 Rejected.

These elections had

  • completely different turnouts
  • precincts changes between 2016 and 2017
  • partial precincts for some of the February Special Election 
  • and (for convenience) I am using 02/2018 active registrants total for all elections. 

I am wary of narratives that show Republican strength decreasing either here or across the nation. The Republican model for securing a favorable electorate looks much different than the Democratic model: social conservatives, quiet Americans, silent majorities may not march in the streets as much, but they may well meet at church every Sunday.  This doesn't mean Republicans aren't winning votes or that Democratic activism isn't alienating swing voters.  Click to enlarge chart.

Saturday, February 24, 2018

Certified February Special Election Data


Below are cor.tests for 2016 and 2017 candidates vs. 2018 BPS501 results per precinct.  A full list of non protected precinct data is below with 2016, 2017 election results and 2018 BPS bond results. You will need to view this on a wide screen, not a phone. This is stats heavy with no added chit chat.

Monday, February 12, 2018

How the BPS 501 Bond Vote played Out (updated with Final match back and Results)

Both BPS 501 bond and MBS 507 levy have passed.


Bellingham Public School  district 501 (90) 2017 precincts outlined in Black and White. Color scale for City and County are 2016 precinct boundaries colored blue to red representing the  Clinton - Trump difference.  Color and outlines demarcate changes between 2016 and 2017 precincts. Click to enlarge. An online map of precincts from the WC Election office is here.

There were two school district financing measures on your ballot this week. If you live in either the Mt. Baker 507 or Bellingham 501 school districts you could and did vote for:
  • Bellingham School District 501 Proposition 2018-1 General Obligation Bonds - $155,000,000
  • Mt Baker School District 507 Proposition 2018-2 Facilities and Technology Levy
For more information on the BPS 501 Bond itself please see More Information at bottom of this post. The rest of this post contains statistical data simulating the BPS 501 bond vote from 2016 and 2017 election results. Matchback totals and projections have been updated with the final results.  Both the Bond and Levy passed.

Thursday, January 25, 2018

Men, Women, Trump, Clinton, Rural, Urban Votes

Below are a couple of interesting "top 20" precinct lists. The first list are precincts in GE 2016  that had at least 75 more male voters than females ranked by votes for Hillary Clinton. The second list are precincts in GE 2016 that had at least 75 more female voters than males ranked by votes for Donald Trump. In these 40 precincts, it appears rural/urban dynamics are overcoming gender dynamics. These results are merged with 12/07/2016 WA Voterdb, so they will be slightly different results than reported by the WA SoS

Tuesday, January 23, 2018

Top Clinton and Trump Precincts GE2016

Top 100 GE 2016 precincts ranked by percentage with 50 or more votes each for either Trump (beige-left col) or Clinton (azure-right col).  These lists emphasize the Rural/Urban party split in WA. Click to enlarge charts. Best viewed on desktop.

Thursday, January 11, 2018

2016 DJT HRC Precinct Correlations for all WA Counties


R's correlation coefficient  gives us a positive <-> negative correlation score (1,-1). "0" describes no correlation. These results are merged with 12/07/2016 Voterdb so these may be slightly different results than reported by the WA SoS.  Here are the correlation coefficient for 2016 GE precinct votes for DJT (Trump) and HRC (Clinton) from:

2016 LD and CD with KI separated

These should be 2016 WA Congressional and Legislative District returns with KING County votes separated as "KI". The results are merged with 12/07/16 Voterdb so these may be slightly different results than reported by the WA SoS

Sunday, December 24, 2017

LD x County Matrices

County by LD matrix from 11/2017 voterdb plus a matrix difference: 11/2017 - 07/2016.

Saturday, December 9, 2017

GE 2016 and GE 2017: Top Counties

The tables below represent WA counties with over 50K good ballots returned for either GE 2016 and GE 2017.  Information for this post comes from the WA SoS Research and United States Census CVAP data. These 14 counties represent 88% of registered voters for the 39 WA counties for GE 2017.  Columns:

County: These are WA Counties > 50K Registered
Registered: Registered at Time of GE (General Election)
Ballots: Ballots Good Returned
TO: PCT TO ('Turn Out') or Ballots Good Returned / Registered
Ballots_CVAP: PCT Ballots Good Returned / 2015 (released 2017) Citizen Voting Age Population
diff: difference between TO PCT and Ballots_CVAP PCT

Saturday, October 21, 2017

Sunday, August 13, 2017

Part I Primary Election Post Mortem: Matchbacks and Tips on How to Avoid a Challenged Ballot


The results of August 2017  Primary Election will be certified on Tuesday evening. Monday will be the last chance for 200 plus voters to cure their challenged ballots.   Wednesday, many people will be analyzing the final results with implications for the November 2017 General Election. But as a prelude, I would like to talk about the mechanics of the vote with some public matchback  and return numbers available as of last Friday (08/11/2017). These numbers will be updated in the days to come, but are sure enough for my general points.

Tuesday, March 7, 2017

How to get to the Whatcom Conservation District on Tuesday, March 14th

If you are wondering how you are going to get from Bellingham to the Whatcom Conservation District on Tuesday, March 14th (between 9 AM and 6 PM)  so that you can vote for Whatcom Democrat candidate Heather Christianson, I have some screenshots with text for you below the break. But first some thoughts and advice.

Thursday, January 26, 2017

Trump's Digital Campaign and The Effect of Social Media on Our Political Lives.

Below the break is a letter I sent to Democratic Chairman Jaxon Raven's on President Trump's digital campaign. It represents my concern that "Trump's campaign represents the most egregious confluence to date of money, big data, high level computation and neuropsychology". Chairman Ravens responded positively with concern to my letter noting that WA state Democratic party will be attempting to address these and other concerns very soon.  My own analysis is that the use of social media is that single most important driver of political activism in the United States.

Saturday, January 21, 2017

Some data on The Women's March: Are we Preaching to the "Liberal" Choir?

Below the break I have charts the top 50 cities ranked on their high estimates (which will change) based on Jeremy Pressman and Erica Chenoweth's latest data. Three charts (click to enlarge) cover cities 1-7, 8-30, 31-50 respectively. See table far below the break for a printed list of high and low crowd estimates of those fifty cities.  This is what strikes me:

"How many of these top 50 cities did Trump win?"

In our current "Hunger Games Electorate', are the "Capitol" cities marching and preaching to the "liberal' choir while rest of the "Districts" troll, laugh, or dismisses our 'liberal' efforts?  If so, how did the march actually help? 

Tuesday, January 3, 2017

Part I : How We Save the Democrats

How We Save the Democratic Party:
Moving Right on Social Issues, Moving Left on Economics and Electing Millennials to Power


Part I : How We Save the Democrats

Part II : How We Save the Democrats: Additional Thoughts

How We Save the Democratic Party: 

Moving Right on Social Issues, Moving Left on Economics and Electing Millennials to Power


Part II : How We Save the Democrats: Additional Thoughts

Part I here

Thursday, November 17, 2016

Wednesday, November 16, 2016

GE 2016: The Balkanized 42nd LD and a 40,000 strong Trump Vote in Whatcom County

The red/blue (Clinton - Trump) division of Whatcom County GE 2016.

I spent the weekend going over Whatcom County results.  The data in this post will be good until 5:00 PM Wednesday, 11/16/2016. Observations, final thoughts and a plea for your LD 42 Democratic membership follow. The google sheets data for this page can be found here and here. Note: Spreadsheet data updated to 11/18/2016:

Monday, October 17, 2016

Ballots Drop Tommorrow, October 18th...

Ballot drops tomorrow, October 18th. Look for your ballot in your mail.
This has been an unusual election season. Full of ... interesting developments and laden with lots of public interest.  In Whatcom County (and WA State), you should have received your 151 page Voter's Pamphlet. If not, you can read it online. If you are looking for Election Forums in Whatcom County, you can find at least two at the Whatcom County League of Women Voters.  They are:

Wednesday, October 12, 2016

Why do we vote Democrat? Part I


Picture of the author's grandfather (circa 1972). "Bompa" worked on the waterfront most of his life, dropping out of school in sixth grade to support his family. He joined "Harry Bridges and his men" in 1934. During WWII, he and his fellow longshoremen laid on their backs and rolled 55 gallon barrels of oil with their feet into the hull of freighters destined for the war effort. After the mechanization of the waterfront, he became a hod carrier and then a brick mason until his retirement at 65.

Why do we vote as Democrats?

It would be 82 years ago that my grandfather was shouldering 100 lb. sacks of sugar from ship to warehouse on the Oakland waterfront. The year was 1934 and the times were desperate. During my youth, when the discussion turned to politics  my grandfather would often say with some emphasis:
"We knew people, Ryan. We knew people who were hungry. They were standing in the bread lines and starving to death!"

Tuesday, October 11, 2016

Friday, September 30, 2016

Why you should check myvote.wa.gov before October 10th...


Editor's note: The deadline for online registration (October 10th) has passed for this year. If you are a new WA state resident you can still walk into the Whatcom County elections office until October 31st to register. For all other questions, please call the Whatcom County Elections office at the contacts here: http://www.whatcomcounty.us/1732/Current-Election . Thanks, -RMF

Monday, August 22, 2016

"How and Why Donald Trump and Republicans will win Whatcom County this Fall."

"First, don’t think of an elephant. Remember not to repeat false conservative claims and then rebut them with the facts. Instead, go positive. Give a positive truthful framing to undermine claims to the contrary. Use the facts to support positively-framed truth. "  - George Lakeoff from https://georgelakoff.com/2016/07/23/understanding-trump-2/
I published the blog post below the break  ("How and Why Donald Trump and Republicans will win Whatcom County this Fall.") on August 22nd, let it run for a week and then I pulled it because I thought it was very negative. But I've changed my mind. I think many Clinton Democrats are operating in shrinking closet, accomplishing little but kibitzing with one another on why they think Donald Trump can never be President of the United States.  November may well bring a Republican landslide of epic proportions here in Whatcom County and the state of WA, if the numbers I have looked at are indicative of the general election. Personally, I think it is a really bad idea to sit around and bitch about Donald Trump. You are wasting time you could be using to support Democrats. My guess is George Lakeoff would agree. Here are some ways you can support the Democratic Party, even if you really don't like Hillary Clinton or the federal (e.g. "super delegate") candidates:

Tuesday, July 26, 2016

Withering Primary Participation in Whatcom County and WA ahead of August 2nd Primary

May 24th and August 2nd  (2016) Primaries in Whatcom County: Comparing 'AVReturnedDate' by volume. Click to Enlarge.
Whether because of summering students or depressed Berners, primary participation in Whatcom County and across WA is unimpressive to date. After a strong weekend showing of 3,990 ballots on Monday, an underwhelming 430 ballots were received today (Tuesday) bringing Whatcom County's turnout to 12,557 (9.49%) with five (5) counting weekdays left. It is an unfair comparison due to student participation in May, but the recent Presidential Primary had 30,869 ballots received in the same number of days ahead of May 24th, 2016.  Most of the state is doing no better than us: www.sos.wa.gov/elections/research/Ballot-Return-Statistics.aspx.

Tuesday, July 19, 2016

Monday, July 18, 2016

Who do I vote for?

If I were a voter in Whatcom County, my number one question right now is: "Who do I vote for?"

Come August 3rd, if you eventually find your precinct turnout is low or that falloff is high, the lists below the break taken from the sample ballot might explain why.  PCO elections are not listed here. I am imagining a wave of electoral choices washing over casual or "low information" voters like a rogue wave overwhelming an unaware beach comber. 8/10s of 1% of all ballots have been returned by this morning.

Ballots Mailed: July 13, 2016
Number of Registered Voters: 134,011
Ballots Returned: 1,093
Percentage of Ballots returned: 10:59 AM 7/18/2016
(1093/134011) * 100
[1] 0.816

Friday, July 8, 2016

Demographics from the July 6th WA State Voterdb

WA State Voterdb as of June 6, 2016

Monday, May 30, 2016

Whatcom GE 2015 vs Whatcom Presidential Primary 2016

The 2015 GE had about 7K more votes than the 54K 2016 Presidential Primary.  In the quantile (equal-frequency) class intervals  and the spreadsheet below the break, here is what Bellingham and  Whatcom County turnout looked like per precinct last week and six months ago.

Sunday, May 29, 2016

May 24th Presidential Primary in Whatcom County

Click to Enlarge

In Whatcom County, Sanders walloped Clinton in Presidential Primary. 53,234 ballots have been counted according to the Auditor . I have 54,074 good ballots  with a party selected received  from 5/27 matchbacks. Certification is June 7, 2016.

Thursday, May 26, 2016

Tuesday, May 24, 2016

Really Good Reasons to Vote Today in WA

Really Good Reasons to Vote Today in WA for a primary that some might characterize as superfluous:


Thursday, May 19, 2016

PCO Candidacy Data as of 11:24 AM 5/23/2016:

PCO signup Data as of 11:24 AM 5/23/2016:
As of Monday the Democrats have a 149 - 74 edge on the Republicans for candidates for PCO. 115 of the Democrat precincts have one or more applicants.

Many Democrats are competing against one another for PCO.  This isn't necessarily a bad thing, especially if everyone gets together, shares responsibility and helps out! 27 Democrat races tonight have 2 or more PCOs. There is only an election choice if there is more than one candidate. Precincts candidates in 302(5 Candidates) might want to consider a meet.

Tuesday, May 17, 2016

"Cooper, this is no time for caution!"

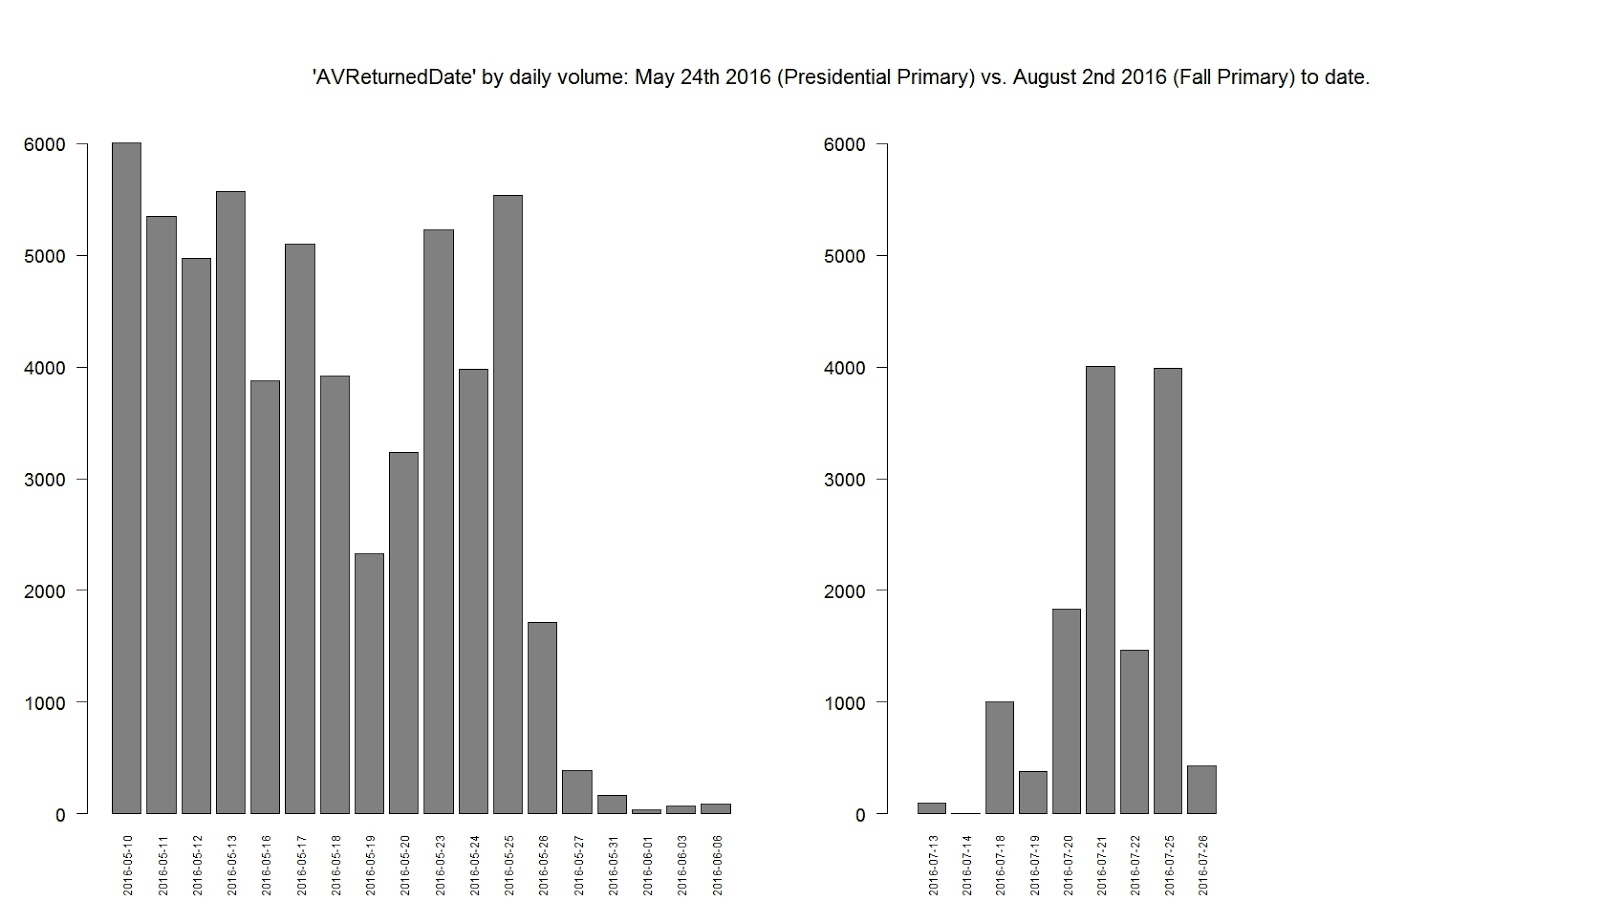
With a week to go, the Primary return numbers are surprising the Whatcom County Elections Office:

Primary Ballots Returned (5:49 PM 5/17/2016) = 29,609

This strong an early return for a primary, even an all county primary, is huge. Keep in mind we barely eclipsed 60K in last November's GE!  The registration counts below the break show us why so many are voting. The registration rolls in Whatcom County are now clearly bloated with youth and Berners.

If you have ever thought about running for office or PCO, now is the time and this is filing week!  Notice in the registration numbers below that those born after 1966 in Whatcom County now eclipse those born before by (66121 - 64694) = 1,427. Notice that those born after 1980 now eclipse those born before 1950 by a stunning (38503 - 27968) = 10,535. Although we are very youth heavy in Whatcom County (thank you WWU, WWC, BTC), these proportions are now not unusual.  See similar numbers for all  of WA far below.

The future is here. Time for the DNC, local Democrats, and the rest of the world to wake up and smell the Millennials and the Berners. Youth and those of us still young enough not to be suffering cognitive degeneration will inherit what remains of the Earth. As my four year old likes to say: "There is no time to lose!" Perhaps I can also quote from the docking scene in "Interstellar": "Cooper, this is no time for caution!"

Monday, May 16, 2016

Illustrating the 42nd LD electorate for 2016; Post Under Construction

Voters of the 42nd LD Precincts sorted into groups of threes: 3 Votes for last GEs (2013,2014,2015), active but no votes for the last 3 GEs, NA for the last three GEs.  These three groups cover 61% of current active registered voterdb for LD42nd.  Based on 4/15/2016 WC voterdb. Click to enlarge. 
Find R (data.table) code here. Post under construction.

Saturday, May 14, 2016

Do you want to become a Democrat PCO in Whatcom County?

Click to Enlarge. Link to larger image here. See also "GIS Precinct Based Maps:Ballots Good, Jack and Joy"

We can talk all we want about the revolution, the corruption, the greed, the incompetence, the futility of the two party system. However, the reality of modern political life means working within the community to spread the revolution, to establish trust, to build alliances with many,  to turn out the vote, to assure that our votes are counted and to make sure the system doesn't fail our children like it has failed us.  

Next week is Filing Week in Whacom County. Would you like to become a Democrat Precinct Committee Officer? This is an elected position. There is no filing fee. Here is information from the WA Secretary of State on the PCO positions:

Wednesday, May 11, 2016

Summary of Posts on County, LD, CD WA data from 04/01/2015 and 05/01/2016

This is a summary of statistical posts I have written recently that may help 'Berniecrats' running for office.  I am pretty much a self taught stats head, however I mean well. Some of my data may be confusing.  If you are a Berniecrat (in WA especially) seeking election and you need help with your voterdb; send me some of your bonafides and I will see what I can do.  I choose to believe most Berniecrats are high IQ by default. I code in R (with help from PostgreSQL and Redis).

The bottom line in the state of WA in 2016 is this: The "Bernie Effect" has meant a huge increase in registrants in WA districts and counties of Millennials, GenXrs, and other generations that support Bernie. The WA state voterdb now has as many active registrants born after 1966 as before. In certain counties, those born after 1980 have swollen the voting rolls to never before seen numbers. All my demographic data suggest to me the influence of boomers and the pre WWII generations is diminishing in the face of a surge of dissatisfied youth looking for progressive change in WA state. As far as I can see, you will be campaigning to a "Bernie Rally" crowd in most cities, counties, and legislative districts in WA.  I can't but help believe from my data, that if you are a Berniecrat challenger to an incumbent, that you will need all these Berners to vote for you!

Tuesday, May 10, 2016

Part IV Data on WA Congressional, Legislative, County Districts: Change in registrants for CC, LD, CD over the last 18.5 months

The tables below give the change in registered voters in WA over last 18.5 months (11.16.2014 - 05.01.2016). The active voting rolls increased 156,614 during those months with 135K of that increase coming from the top eleven counties. King County alone added 50K. Four counties (AS, CU, GA, LI) lost a total of  765 voters.

All Legislative Districts increased their totals. Eight LDs increased registrants by over 4000: 36, 34, 27, 43, 4, 21, 5, and 1.  Legislative District 36 has swollen to ~108K registrants, increasing by 5,481 since 11.16.2014. WA Congressional Districts have also seen large increases in registration. CD 7 increased by 20,837 registrants during those same 18.5 months. At the current pace, CD 7 will have 500K total registrants by 11/2017.  CD 7 and LD 36 (Seattle) are arguably the most Democratic and most liberal districts in the Pacific Northwest.

Sunday, May 8, 2016

Part III Data on WA Congressional, Legislative, County Districts: How many Berners are out there?

The charts and data below the break are dedicated to all you Berners that want to sign up to run  for Legislative Districts next week, the third week of May, when Filing Week opens. See PDFs and FAQs here: 1234 . You are probably wondering how many Berners are out there, will they vote for you, can you really take back that LD and become a progressive force in the Olympia?  I will let you answer all the tough questions while you lie awake at night.  Below the break are some data and charts to chew on.

Sunday, May 1, 2016

Part I Data on WA Congressional, Legislative, County Districts: Birth Years of Registrants - 04/01/2016


Part II Data on WA Congressional, Legislative, County Districts: Registrants Partitioned by CC,LD,CD intersections - 04/01/2016

The top eleven most registered counties are 84% of the state's registered voters. Active WA voterdb registrants from County (CC), Congressional District (CD), and Legislative Districts(LD)  'partitions' are keyed and sorted by count, registration year, last year voted in the tables below the break. . Additional 'mixed queries' are far below. A 'partition' here I define as the unique number of active registrants that result from the (geographic) intersections of particular CC,CD or LD districts. Currently, there are 141 such unique partitions in WA, however the bottom nine exists simply because county voter rolls have not assigned CD and or LD or both to some small number of voters.

Monday, April 25, 2016

Sites Discussing Election Fraud

"We are not able to elect Bernie because there is so much of this fraud and voter suppression and rigging and caucus cheating going on. So it seems like magical thinking to continue to go forward with this campaign and not address the issue, to not fight the battle that will actually cost the election."
- Debbie Lusignan ("The Sane Progressive")

Update on "The Bernie Effect" in Whatcom County

New or reactivated registrations are increasingly younger and more urban in Whatcom County. Click to Enlarge.


Density Curves. Left: Birth Years of Voters who have left the voter rolls in the last 17 months. Right: Birth Year of Voters who have joined voter rolls in the last 17 months. Click to Enlarge.
4,962 net voters have been added to the Whatcom County voting rolls in the last 17 months. 12,428 voters have left or been marked inactive. 17,390 have registered themselves as active. (Yes. That is stupendous number for Whatcom County.) We are adding almost 10 registrants per day.  These registrants would be a mix of original registrations and re-activations  or address changes. The last 17 months have been responsible for 3.9% increase in the voter database since 11/22/2014.

Monday, April 18, 2016

Tim Robbins gives 'em hell for Bernie!!

"Bernie is not the obligatory progressive that will keep the left in line until the presumptive moderative nominee emerges. Bernie is not the Democrat party insider that will bow down to the elites in the party. We are done with that! We are done with compromising our ideals! We are done with triangulation and fear based politics! ...Change will not happen by choosing a candidate entirely entrenched in the dysfunction of the past."

-Tim Robbins at Washington Square Park New York Bernie Rally March 13, 2016 https://www.youtube.com/watch?v=tC-ZCD3gE1Y
 

Thursday, April 14, 2016

Mountains: The 'Bernie Effect', Berniecrats, Millennials Rising

This is a long technical post discussing the effect of the recent Presidential caucus campaign on voter registration in Whatcom County and Washington state and some of the implications of that surge in voter rolls for the November 2016 General Election. More complete technical paper is available (PDF) - RMF 

Saturday, April 2, 2016

"the most honest candidate there is..."

Rosario Dawson, Spike Lee, and Residente rock the Bernie Bronx Rally. Residente gives an incredible speech:  " I support Bernie Sanders because he is the most honest candidate there is."
(Source:  http://www.c-span.org/video/?407458-1/bernie-sanders-campaign-rally-south-bronx )
    

Friday, April 1, 2016

The Bernie Effect in Whatcom County

Note: This is for Whatcom County voterdb data only. For WA state data on "The Bernie Effect" please see links here.
The Bernie Effect: Change totals for voter registration are up 335% in the first three months of 2016 over  the same period in 2015. This may include as many as 4,295 new registrations.  Click to enlarge.  Most data below  the break is for "Registration Date" changes for the period January 1 - March 30, 2016.